Problem
How might we improve driver confidence in semi-autonomous scenarios, where control transitions between human and machine?
Problem & Opportunity
“How might we increase driver confidence in Hyundai’s HDA 2.0 system under semi-Level 2 and Level 2+ autonomy?”
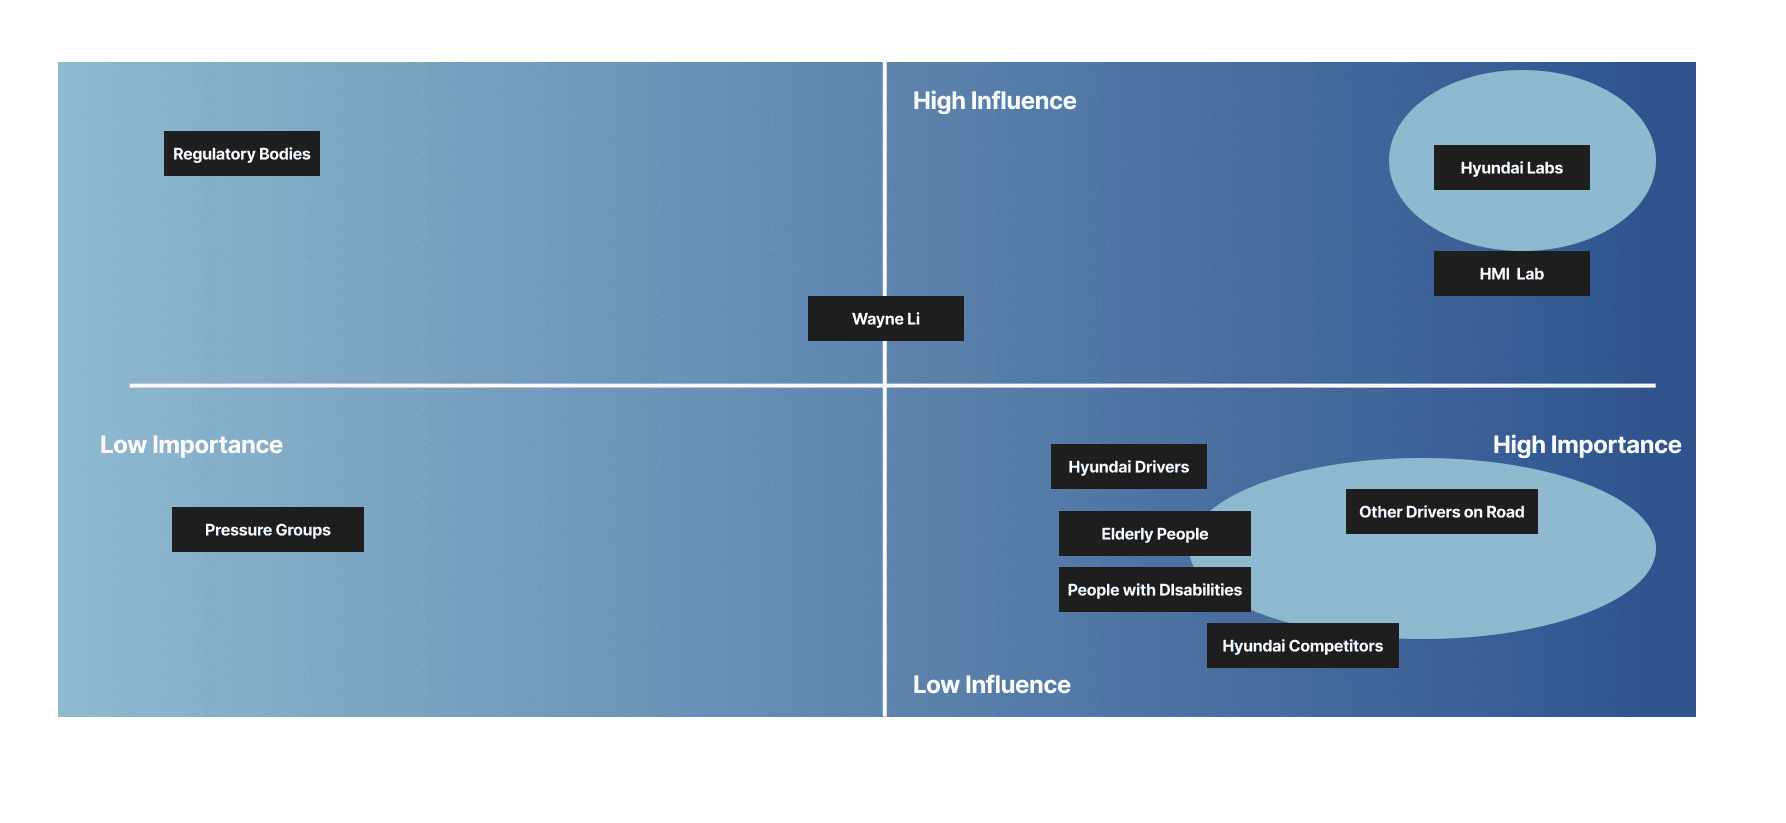
Stake Holder
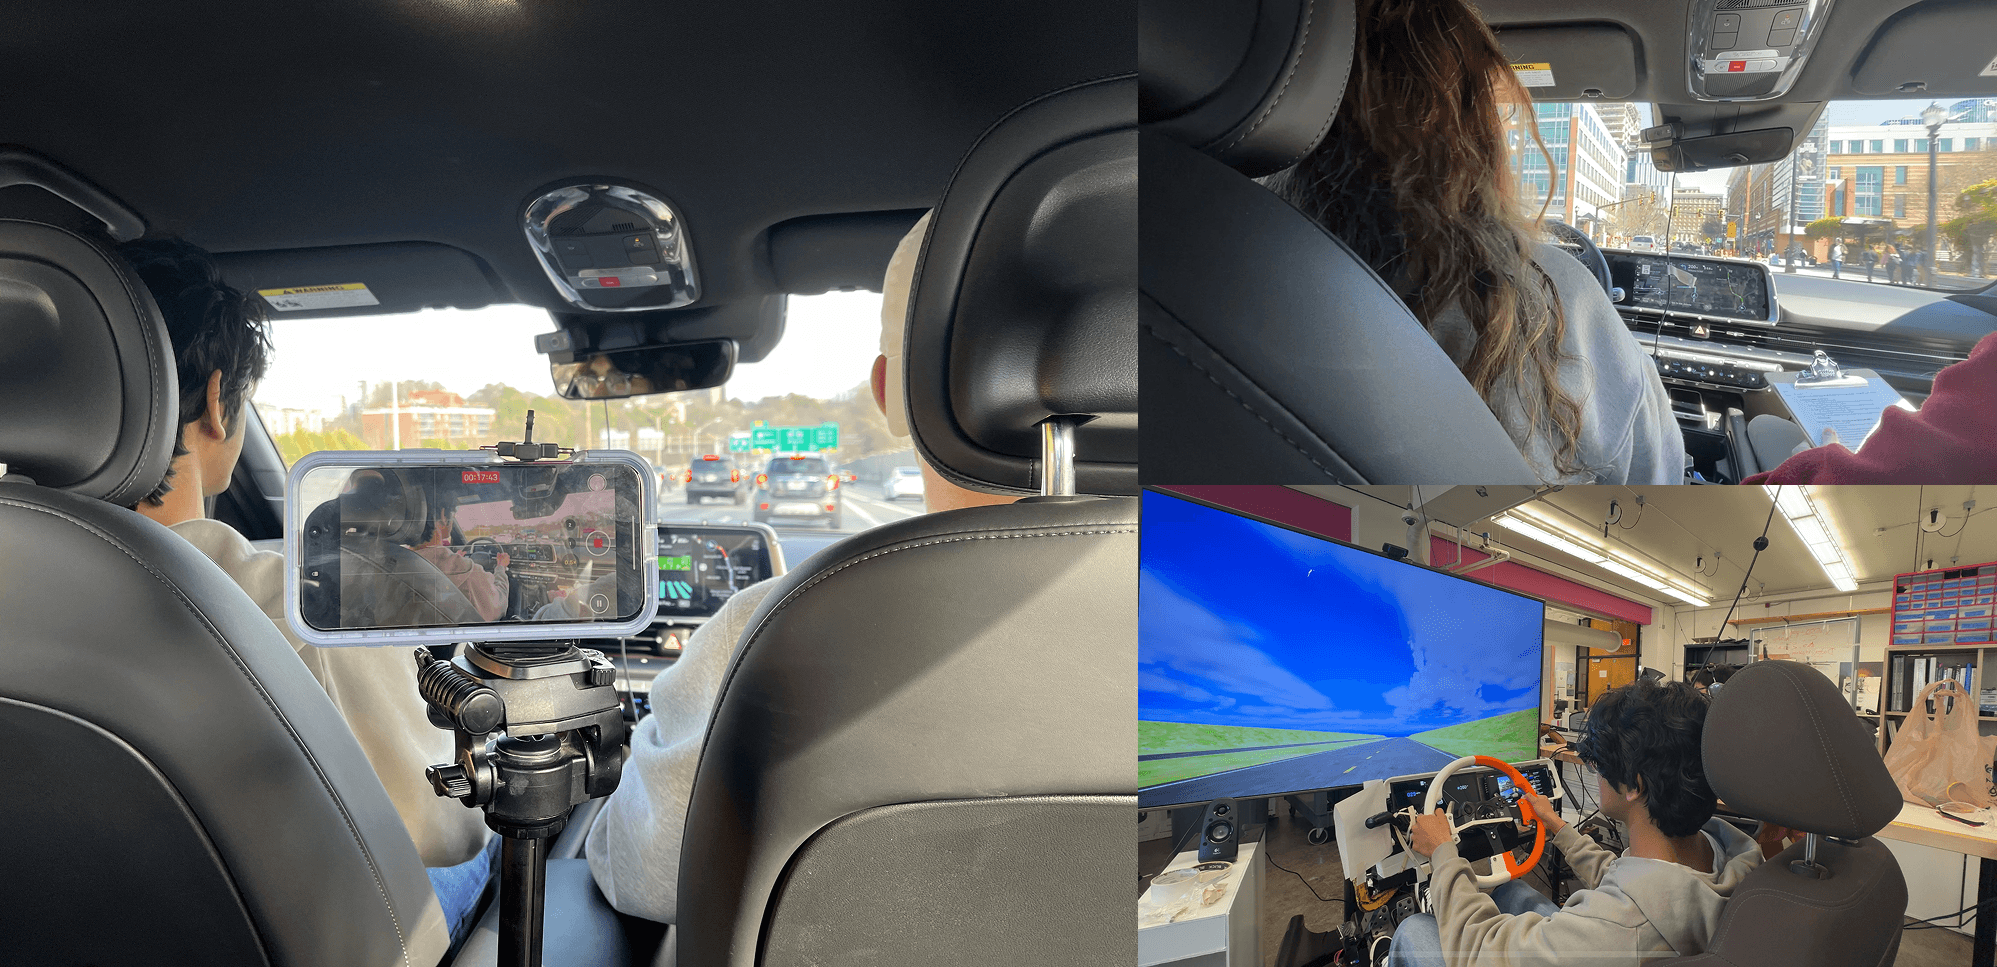
Research + Testing
Participants: 9 drivers in real and simulated conditions
Sensors: ECG (heart rate variability), Tobii eye-tracking, self-report Likert surveys
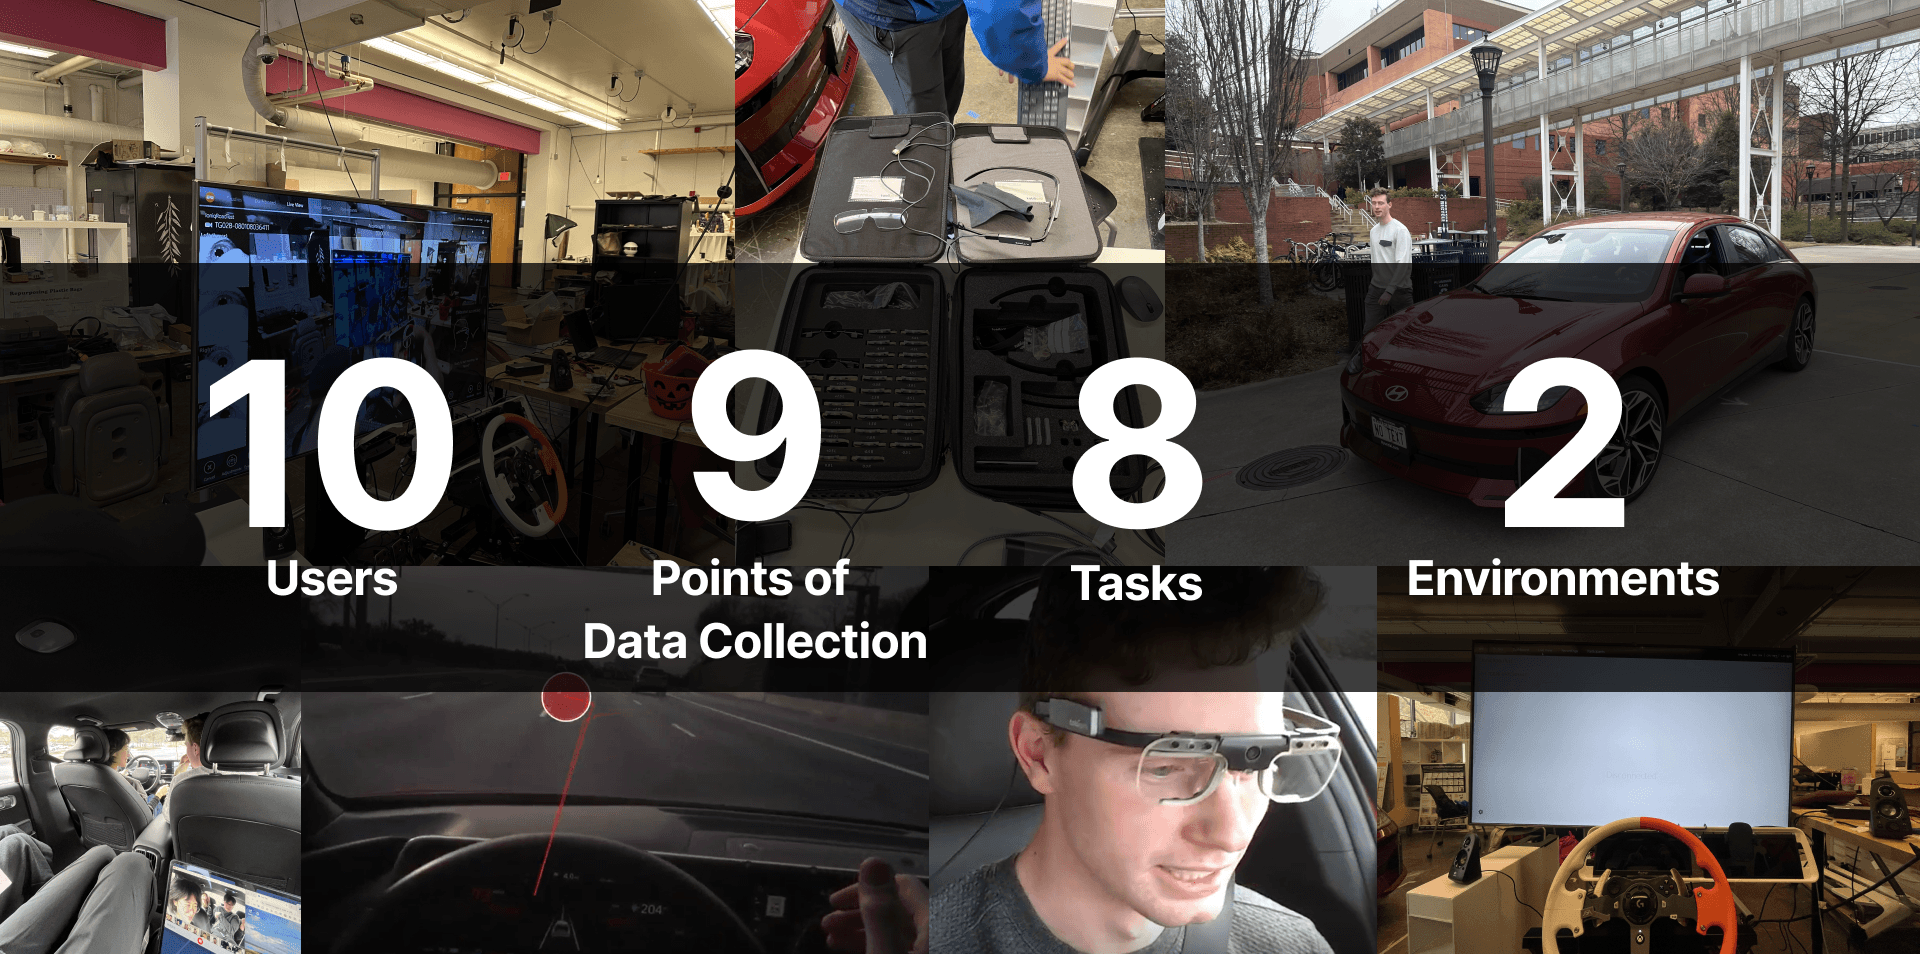
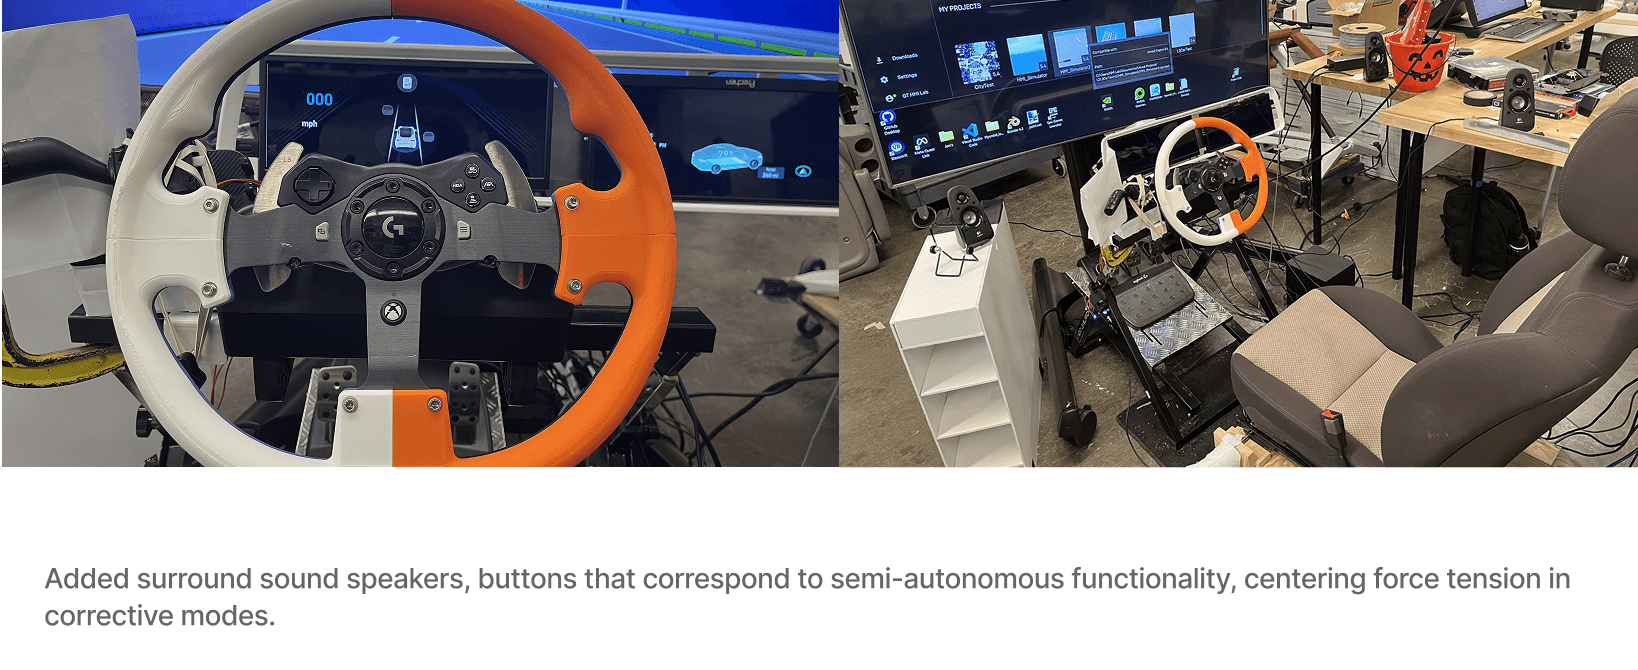
Simulator: Custom Unreal Engine rig with surround sound + highway rendering
Methods Used:
A/B UI testing in simulator
Paired-sample t-test (Sim vs Real)
Confidence metric calculated from biometric + behavioral data
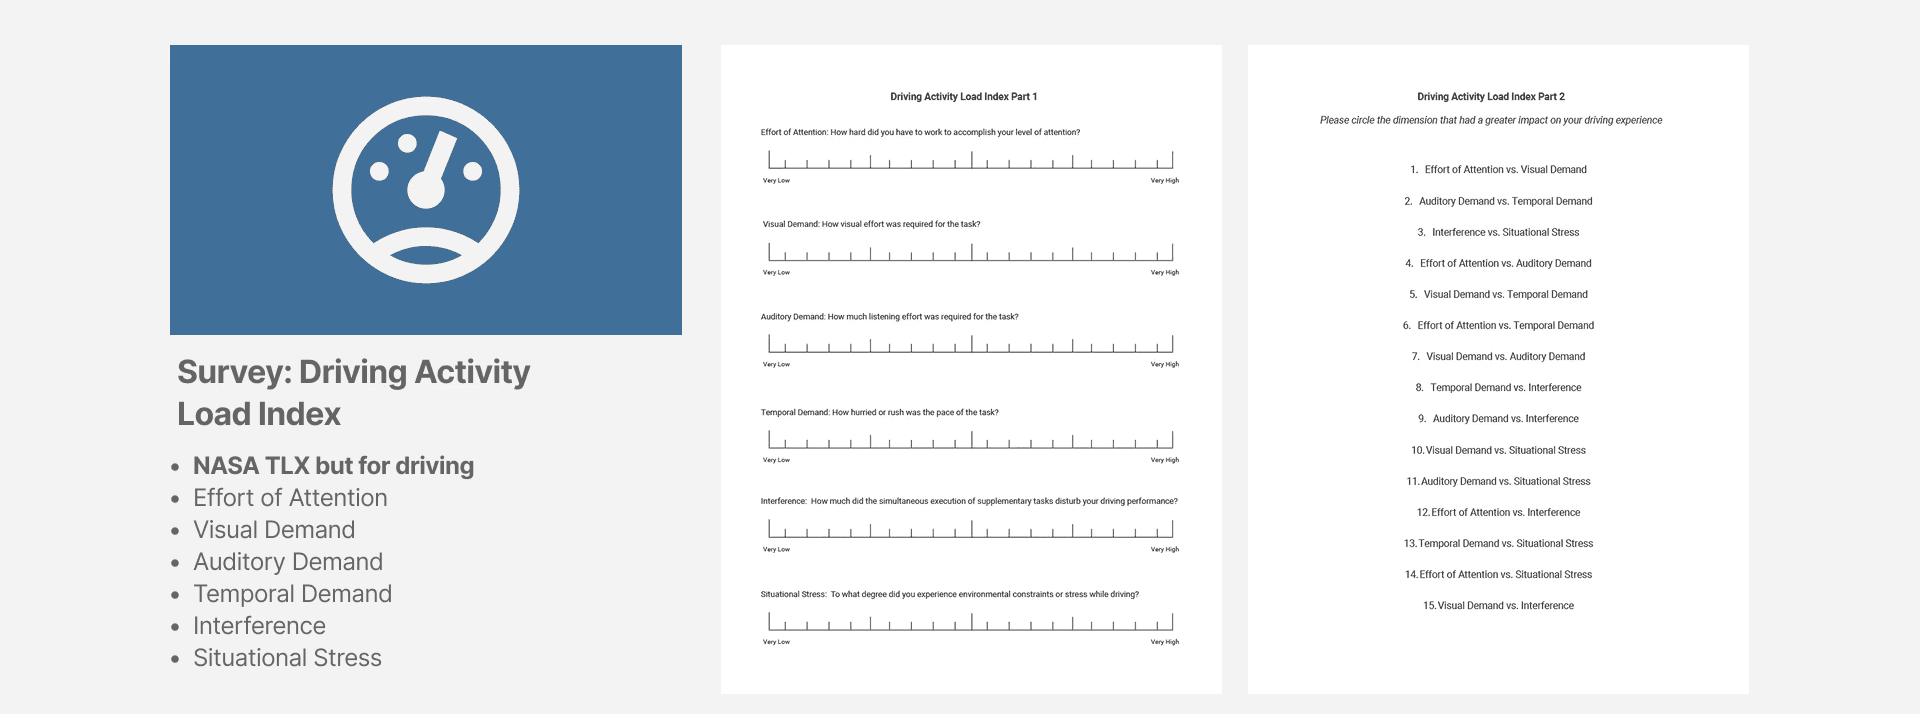
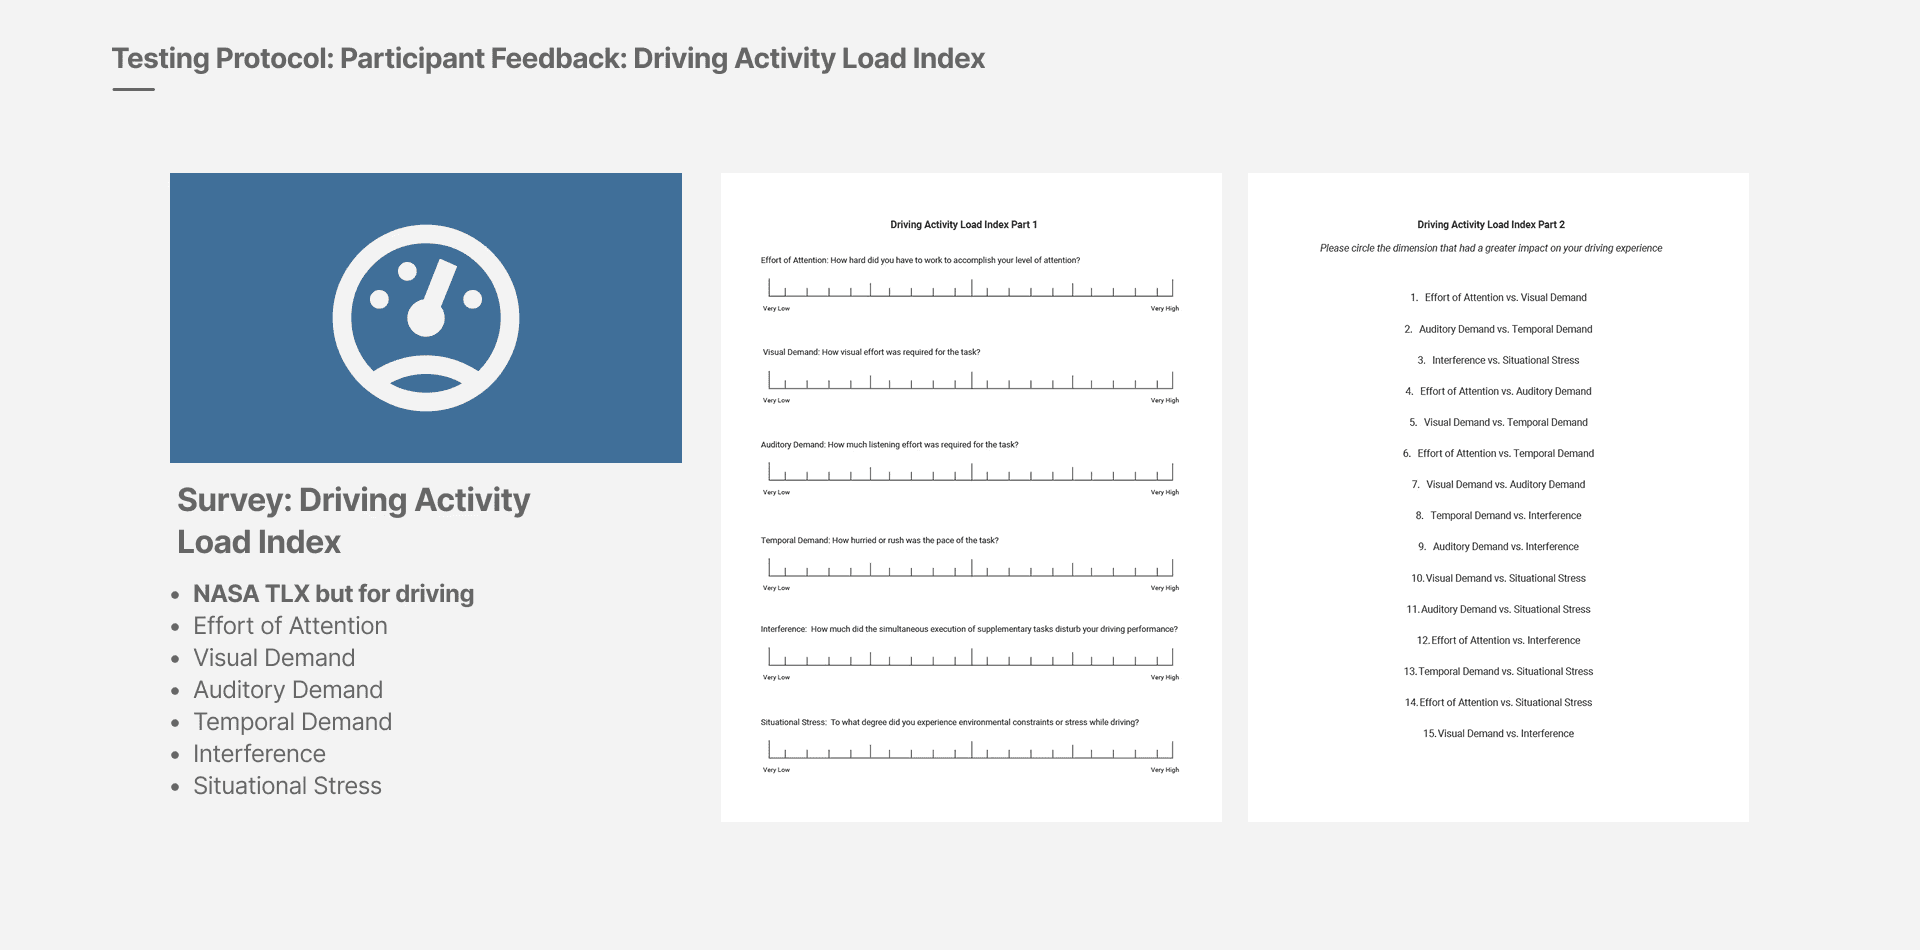
Testing Protocol: Participant Feedback: Driving Activity Load Index
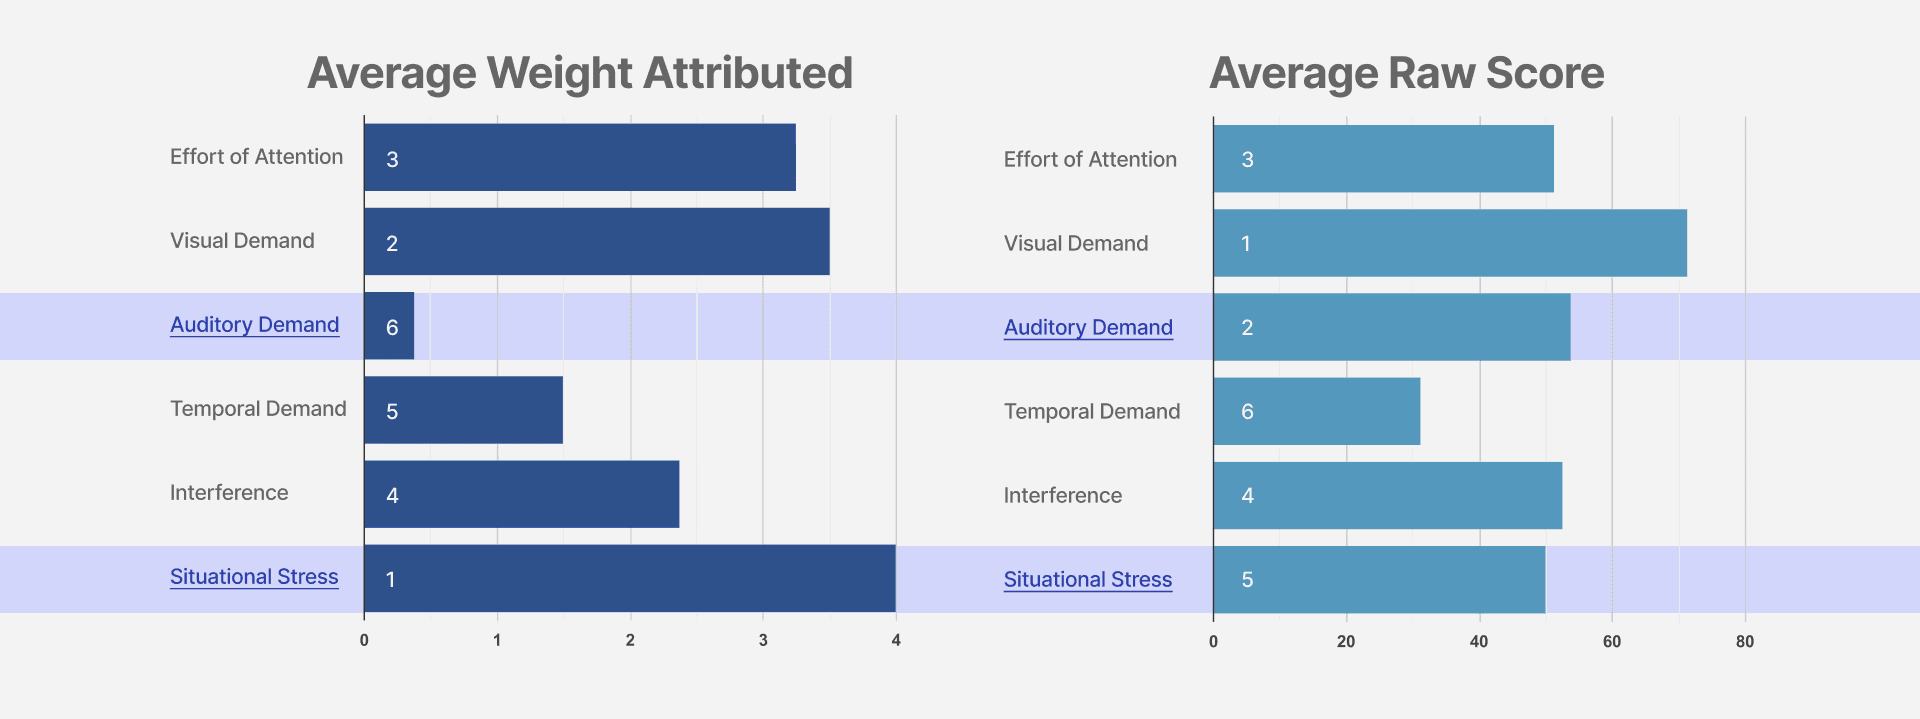
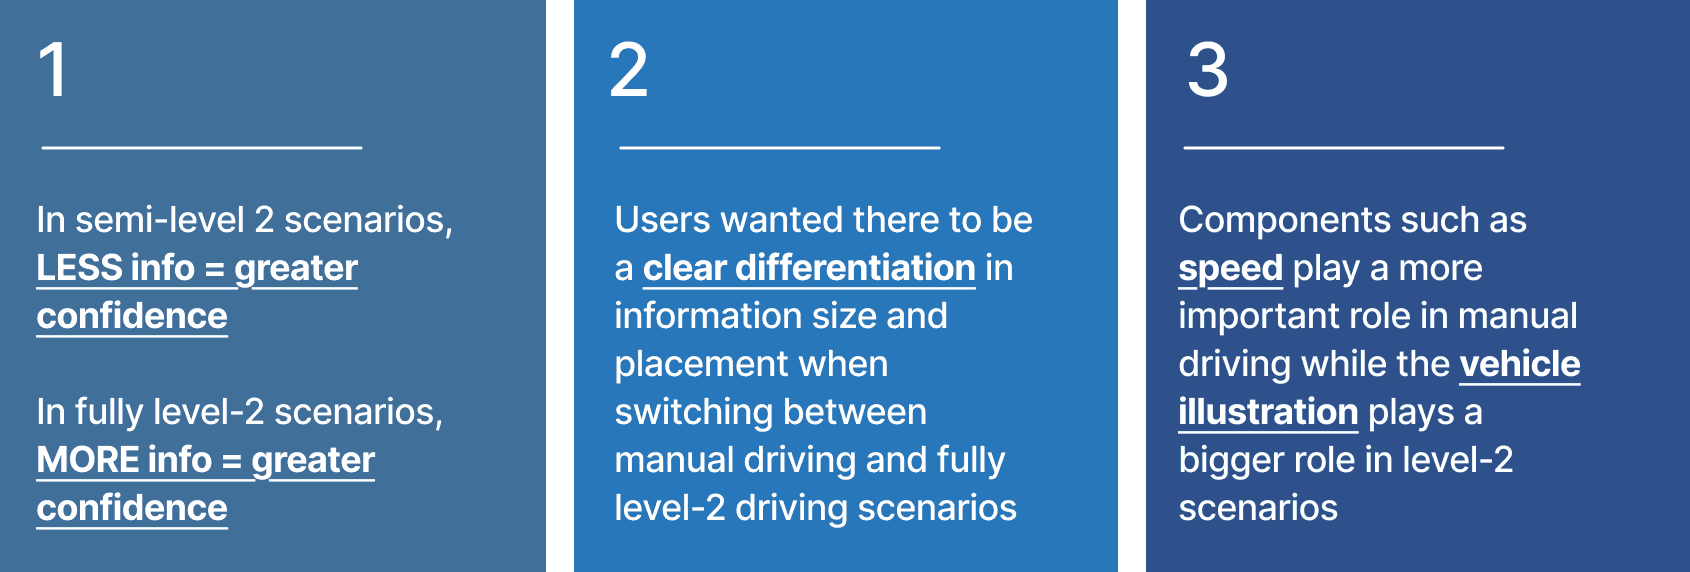
📈 Key Insight:
"Less information builds trust in partial autonomy; more information reassures in full autonomy."
This shaped our adaptive UI model.
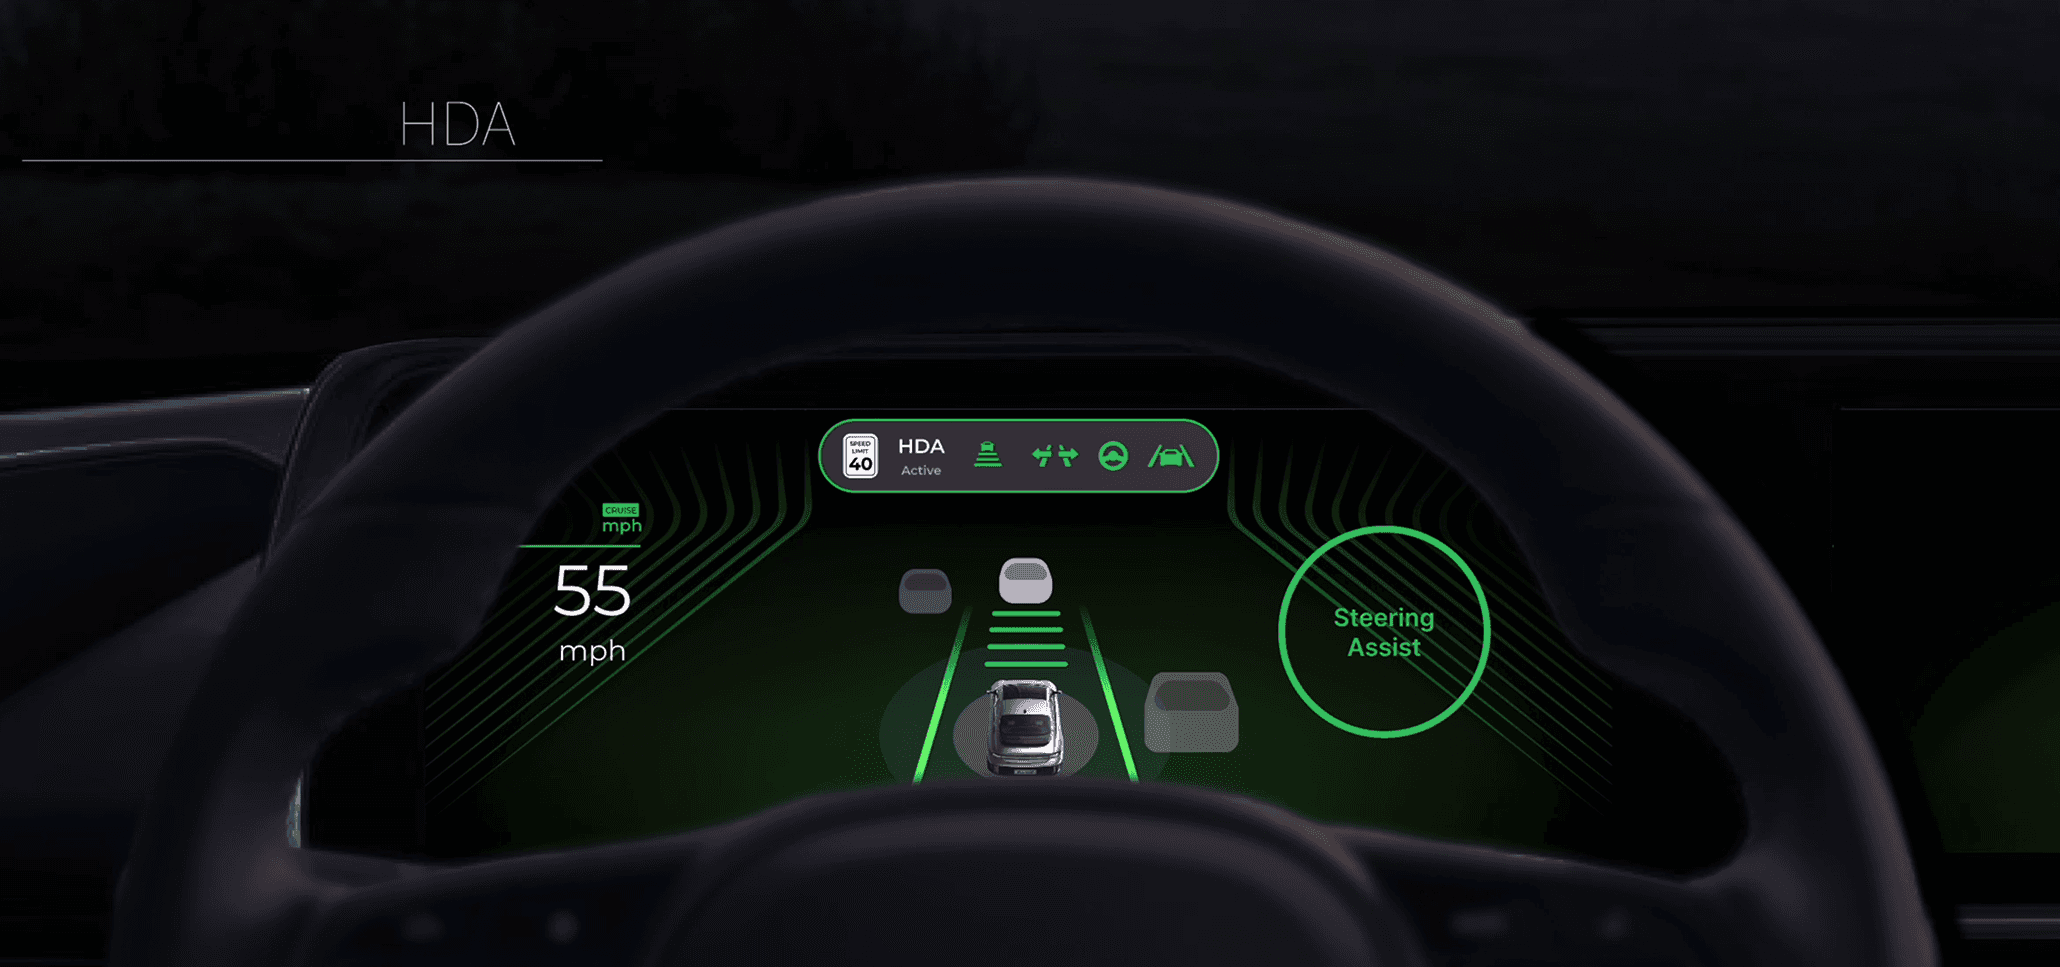
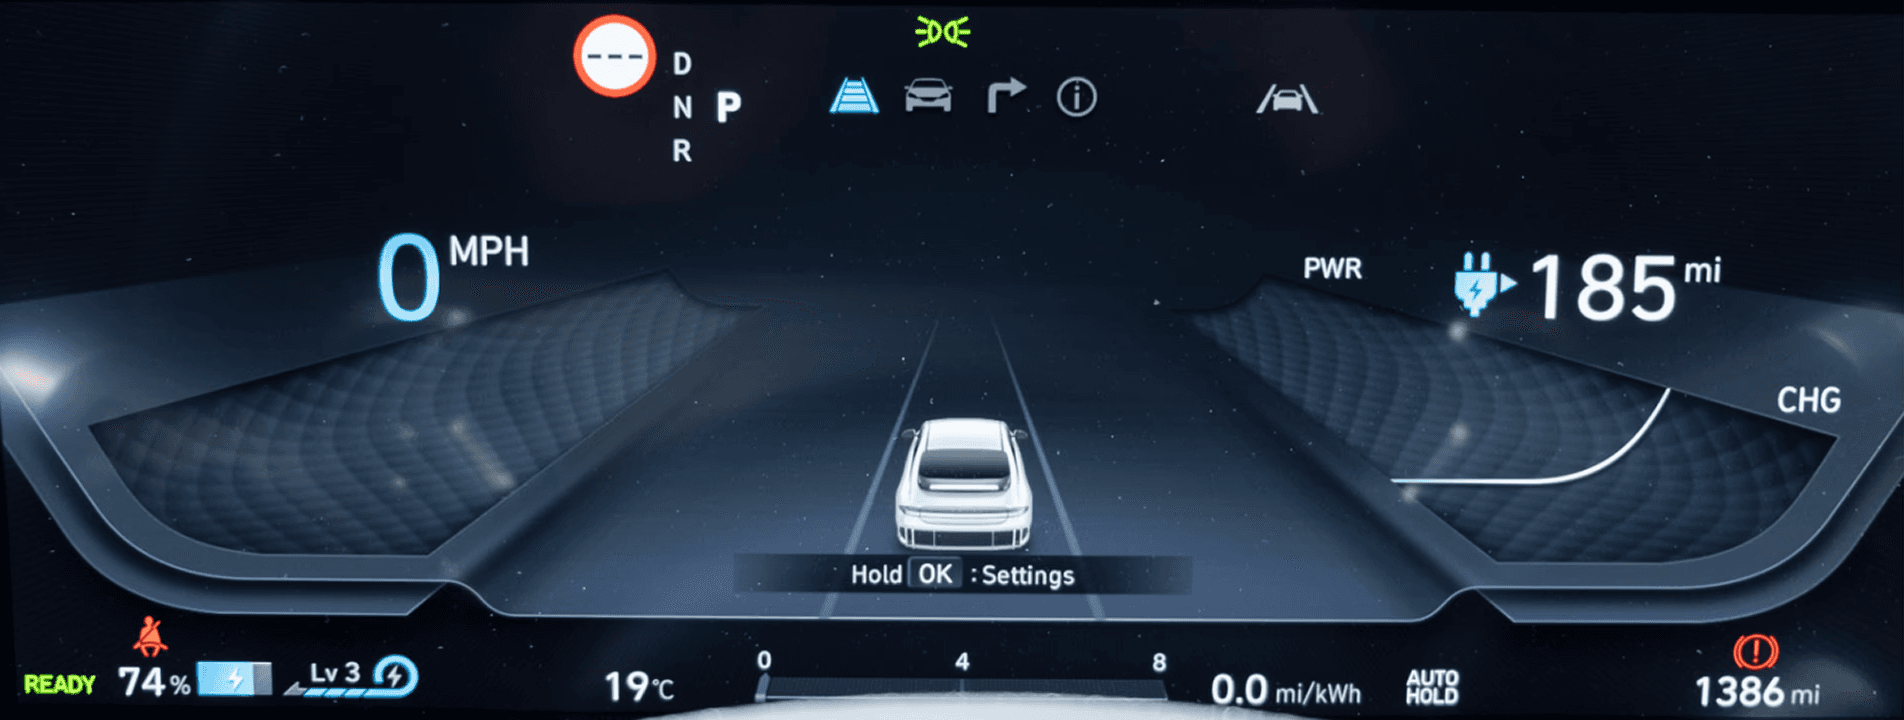
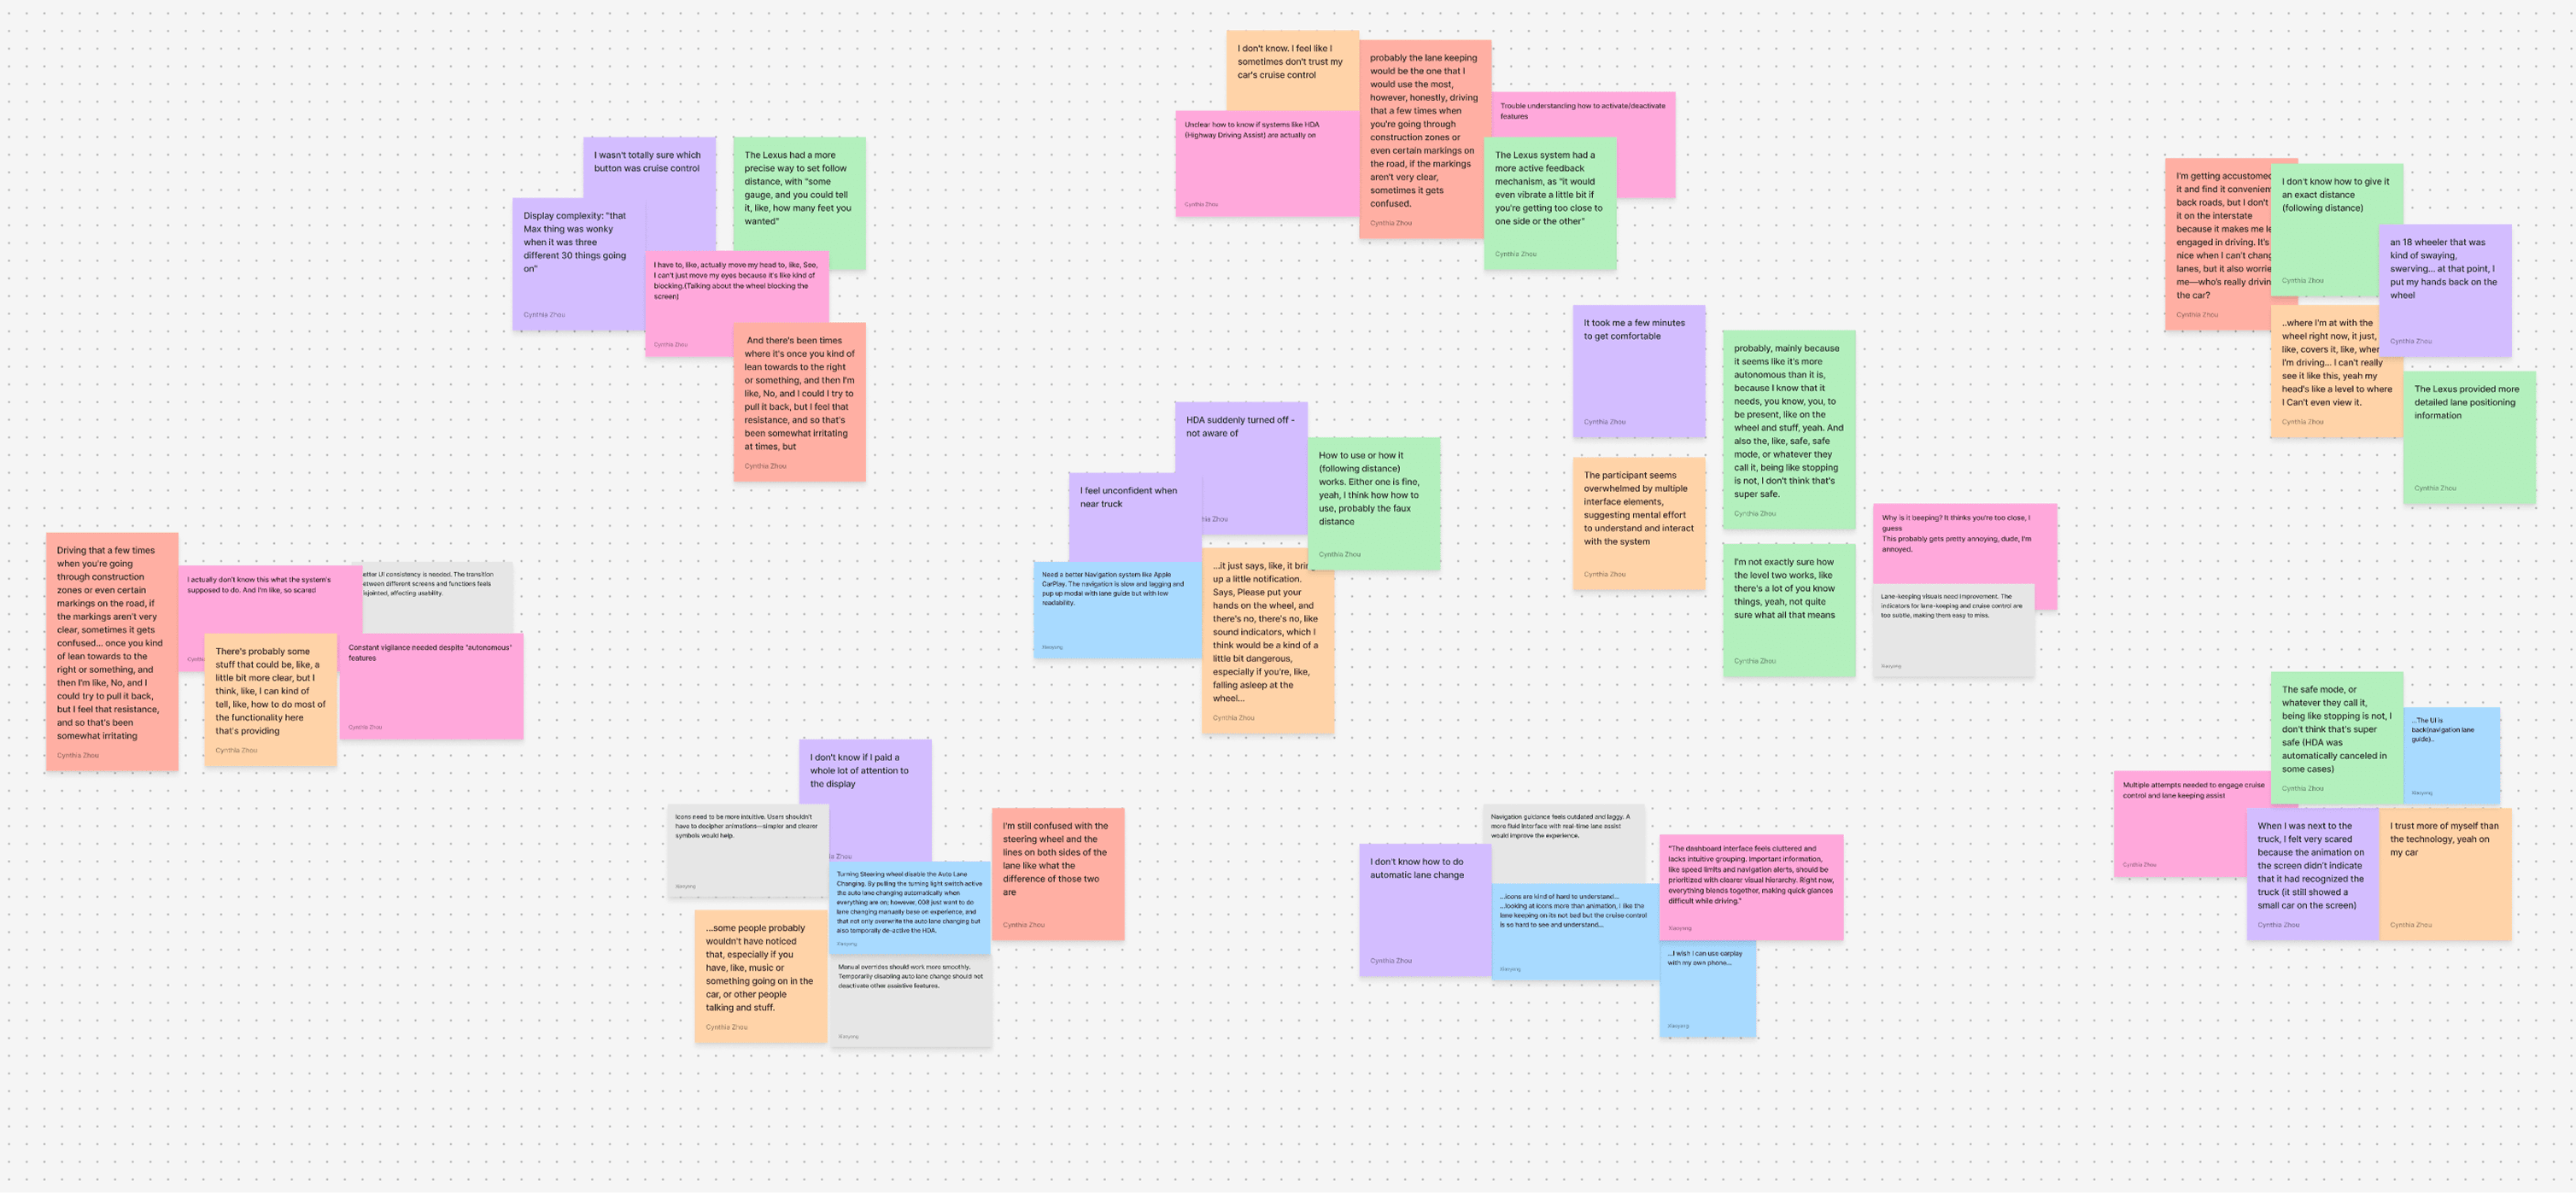
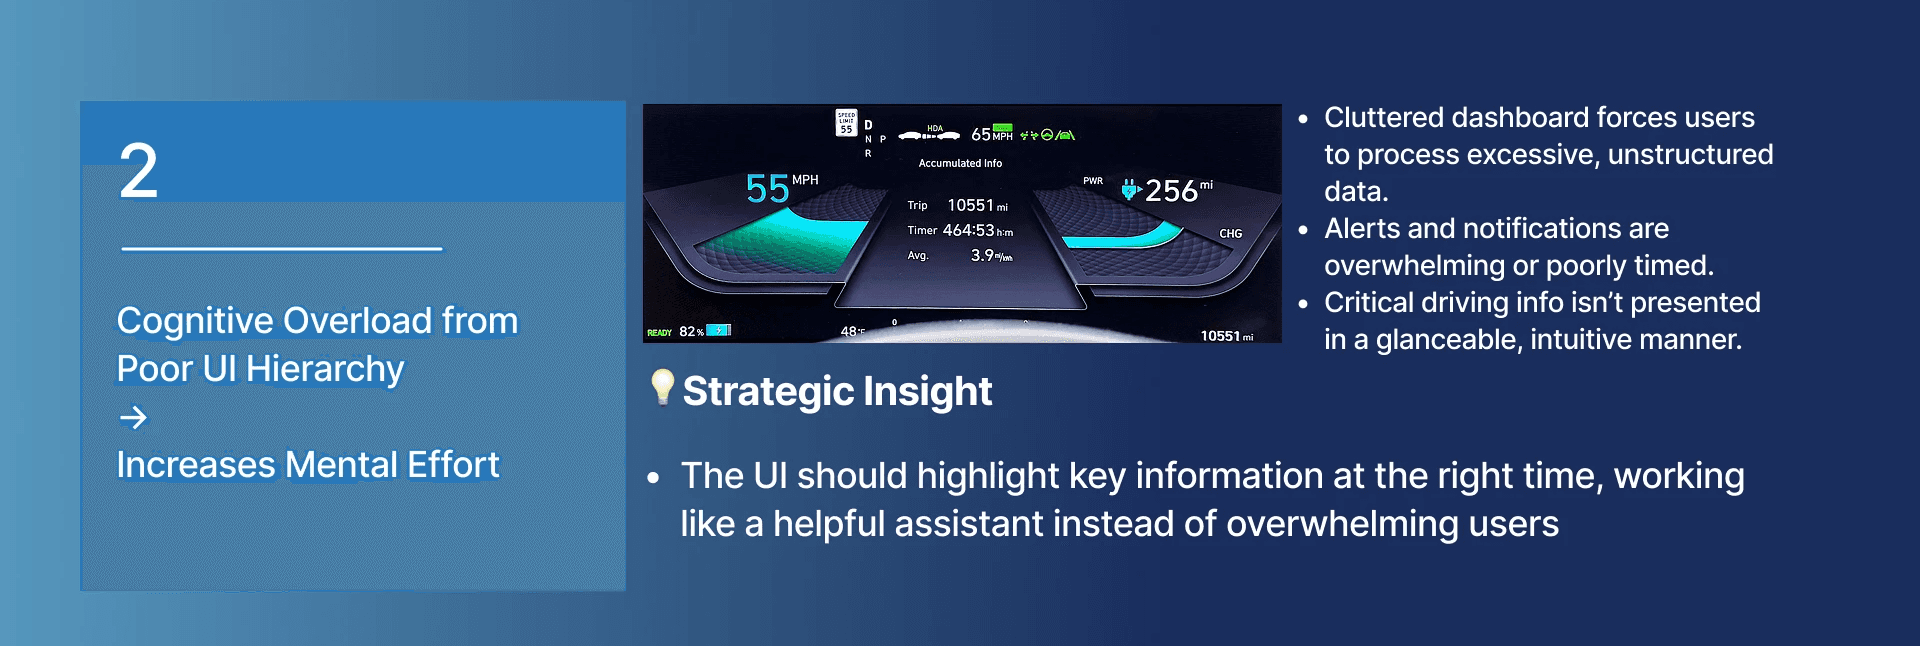
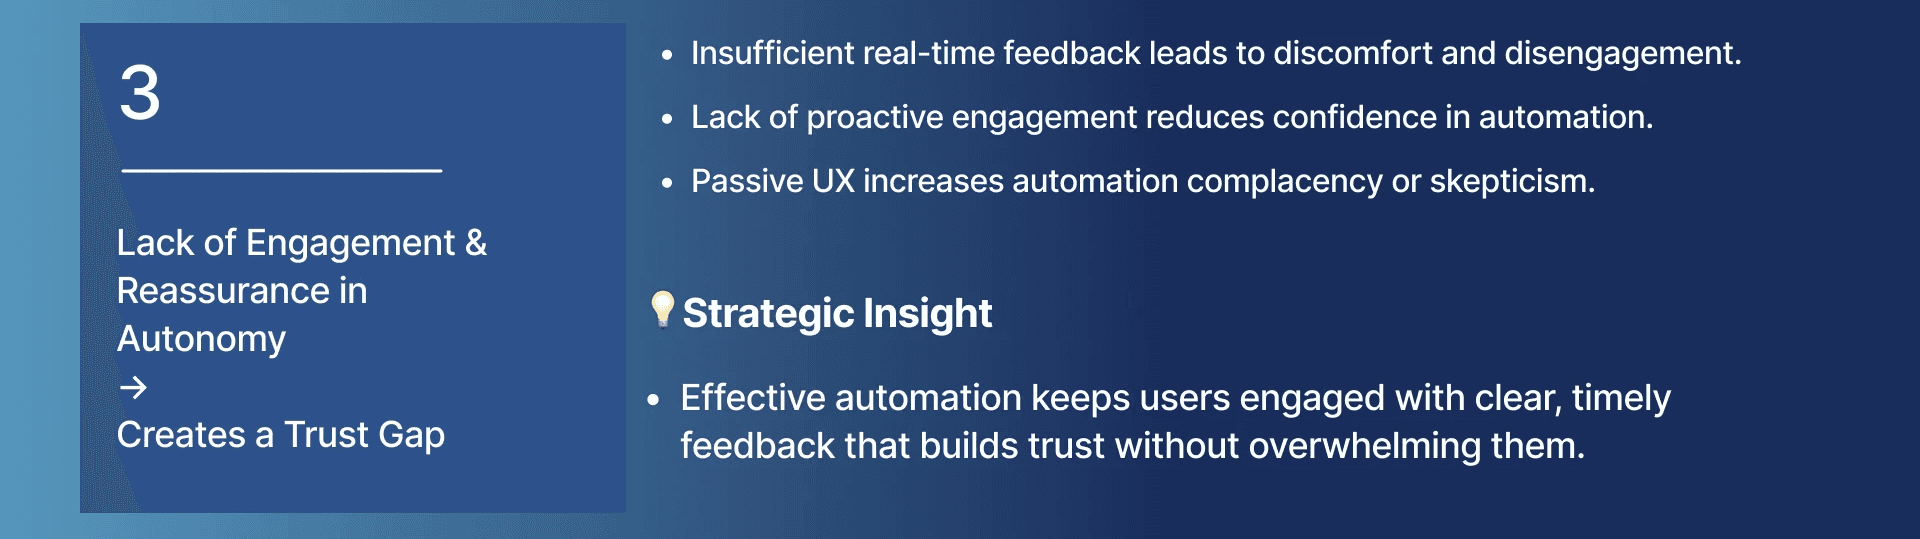
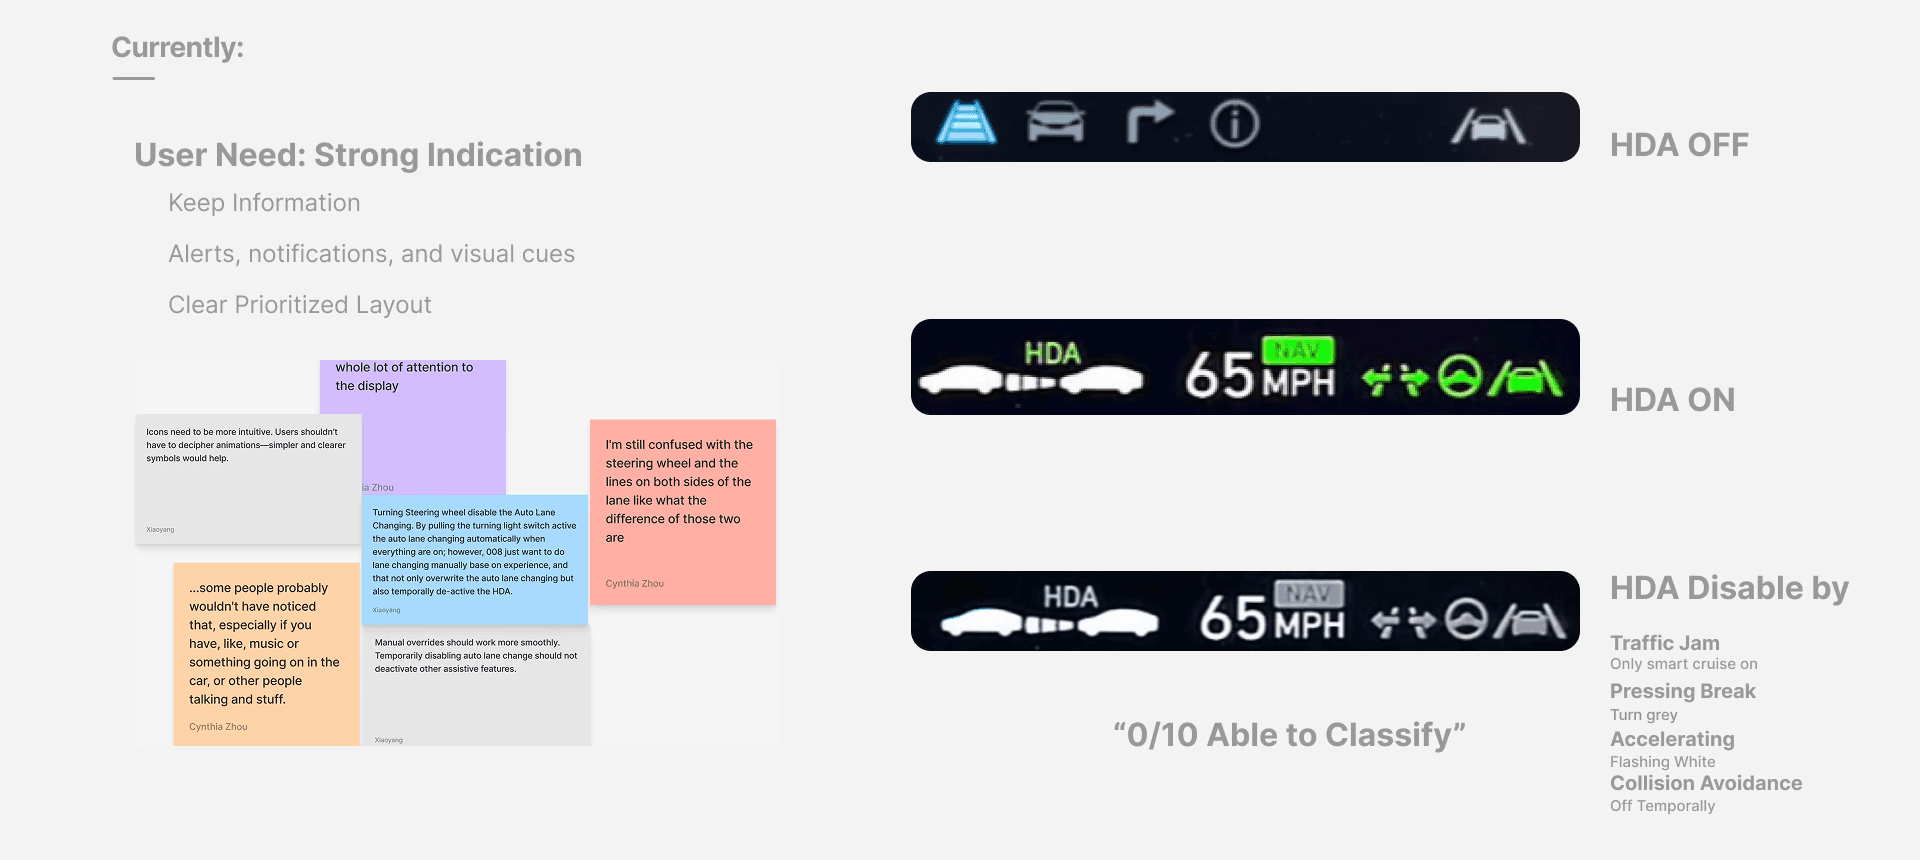
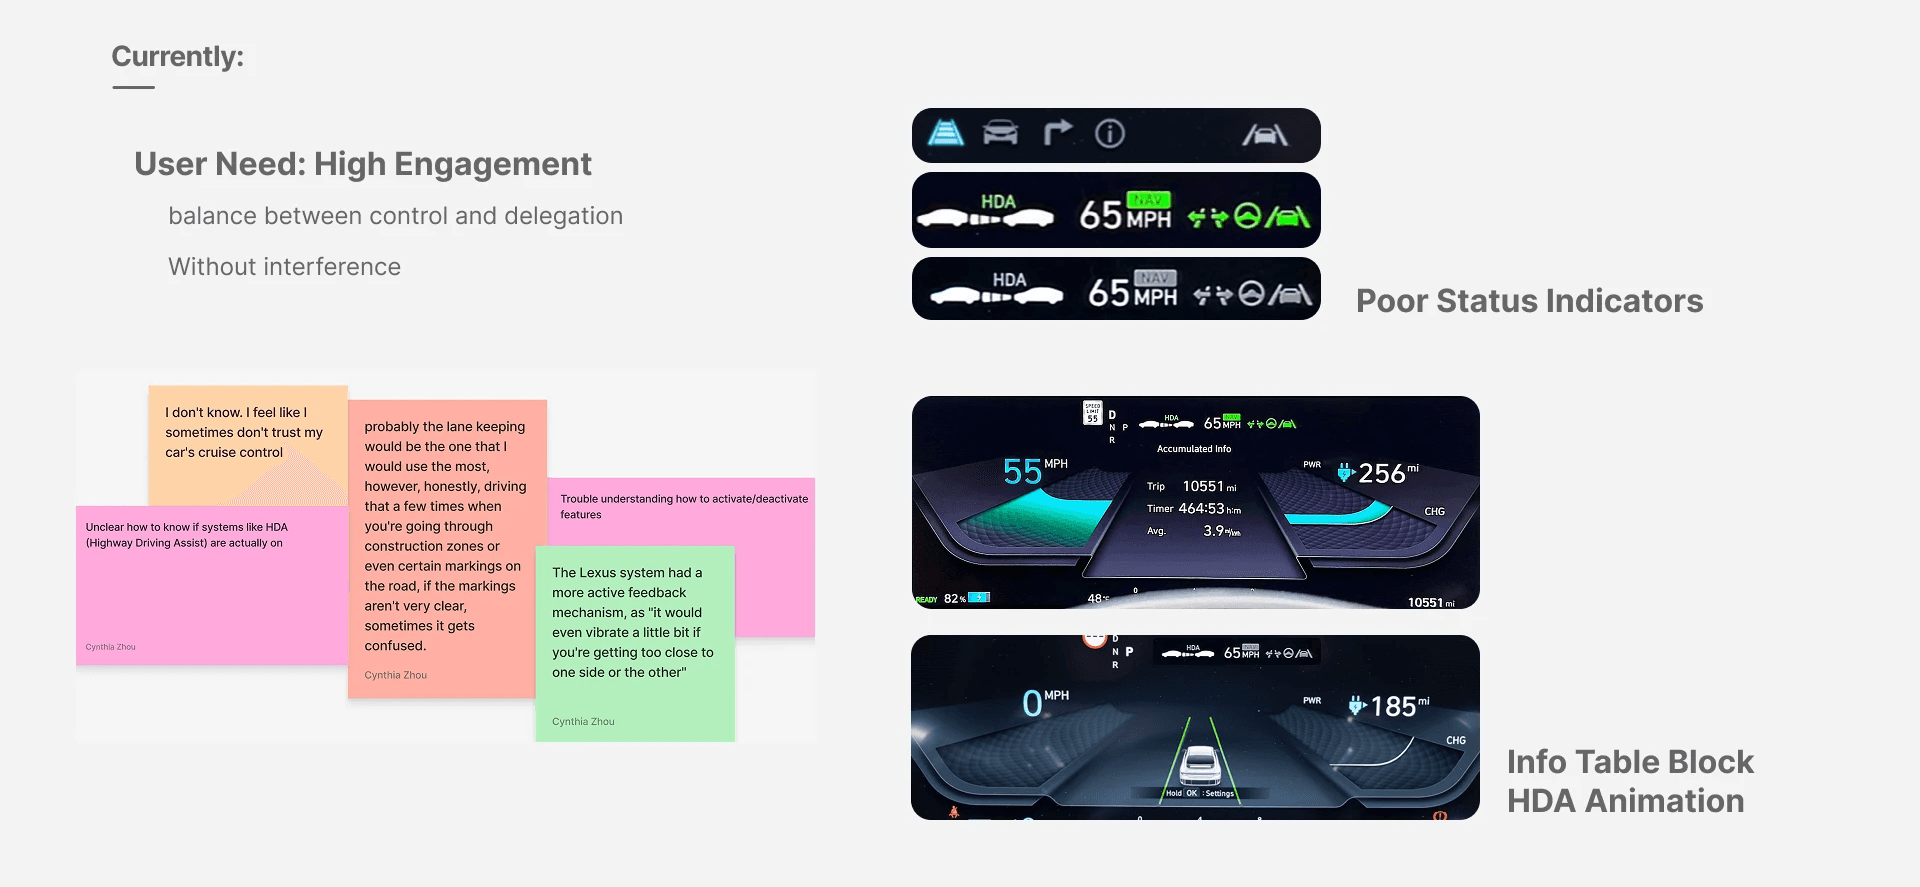
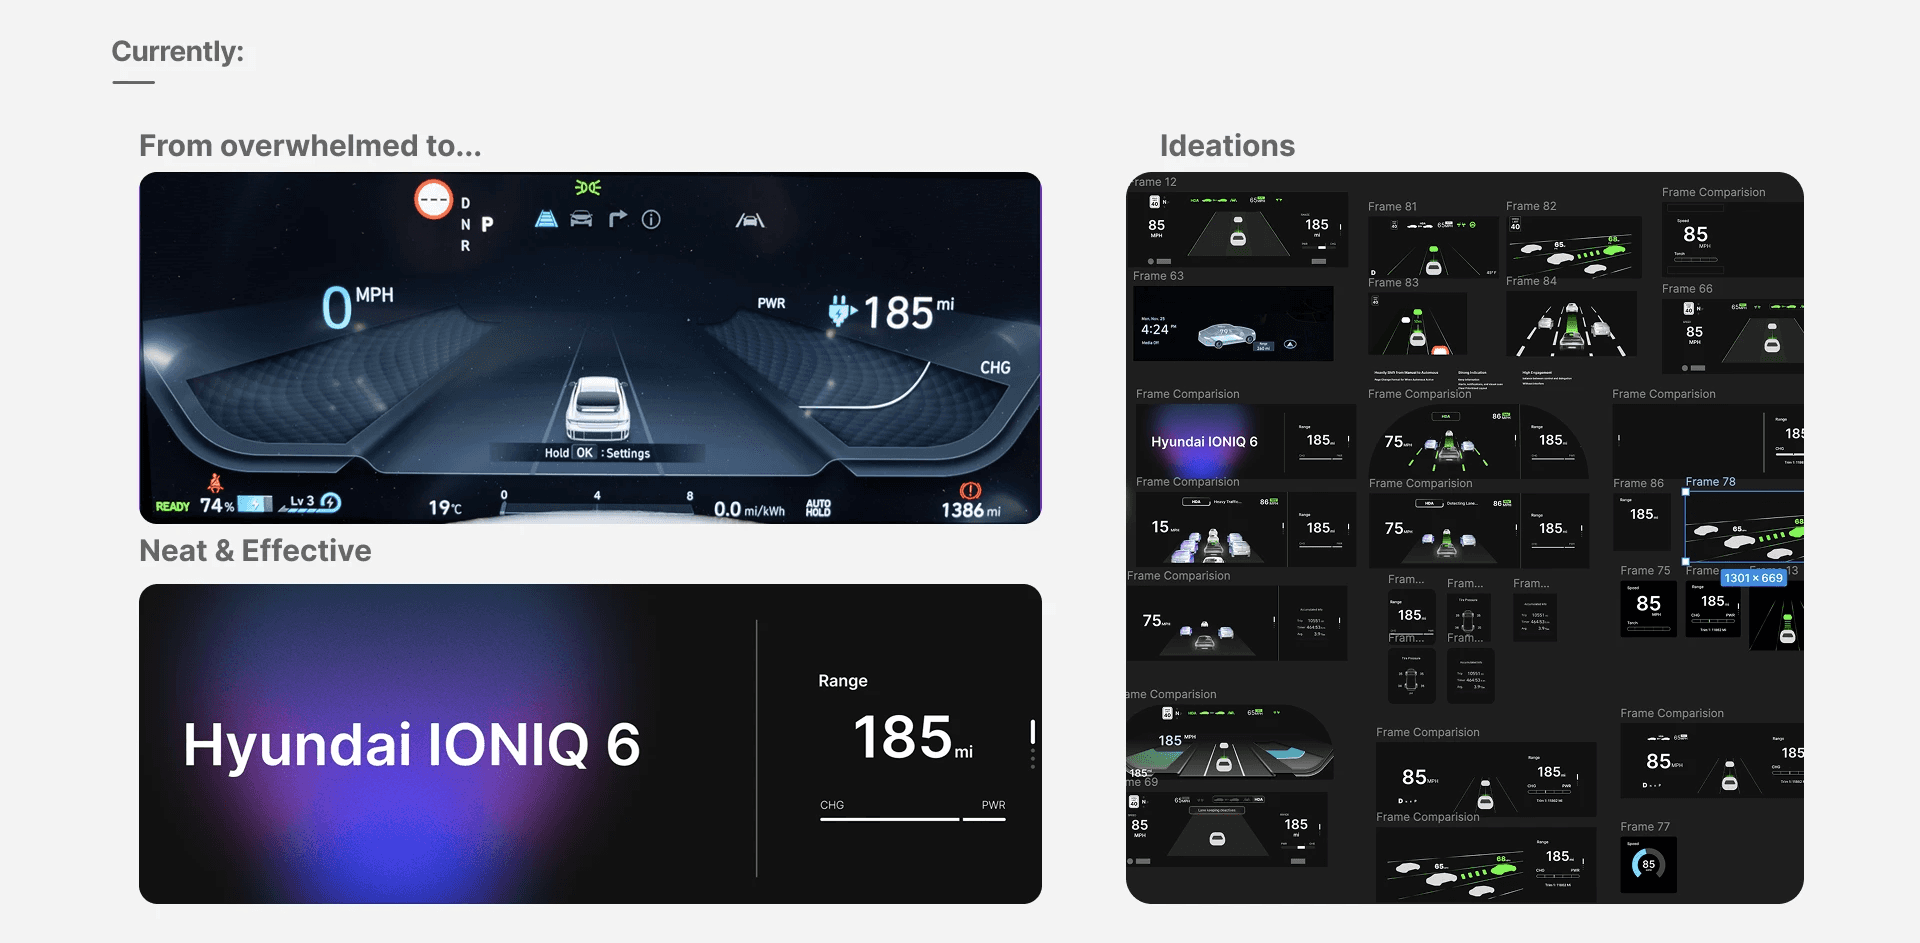
UI Pain Points from User Test Round 1
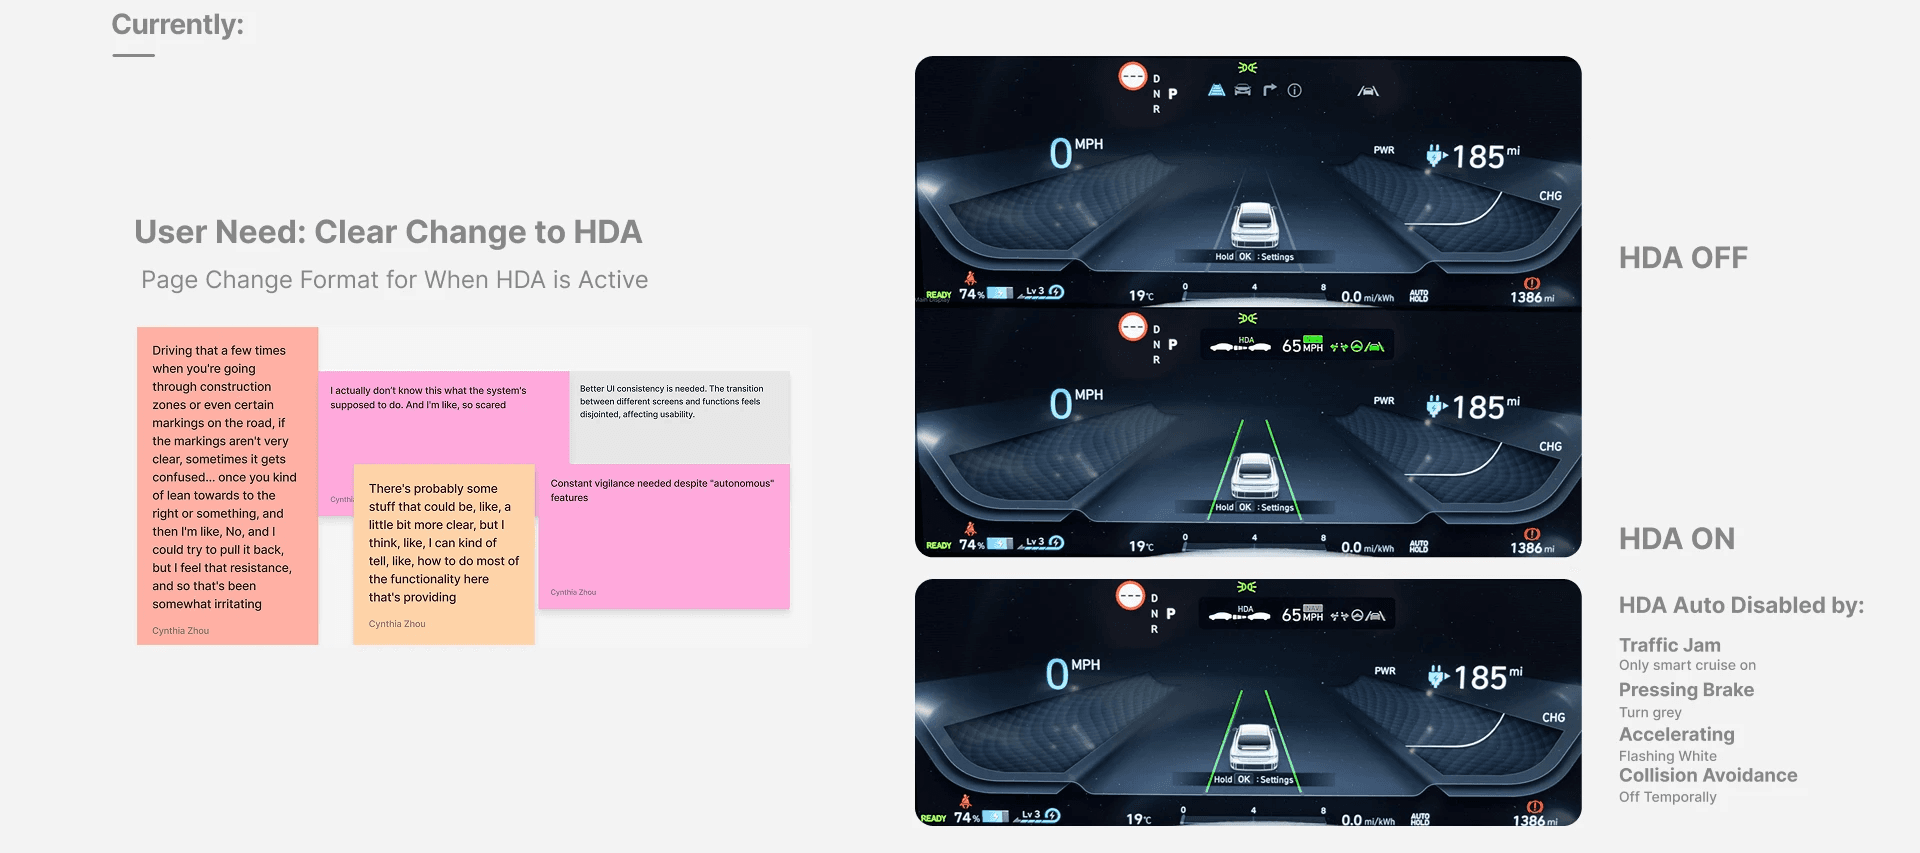
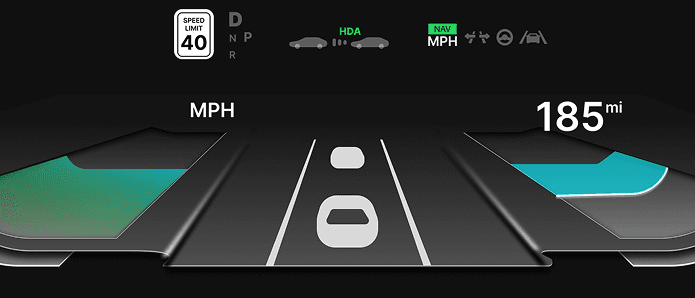
Hyundai’s existing HDA UI lacked clarity, leading to user anxiety in critical driving handoff moments.
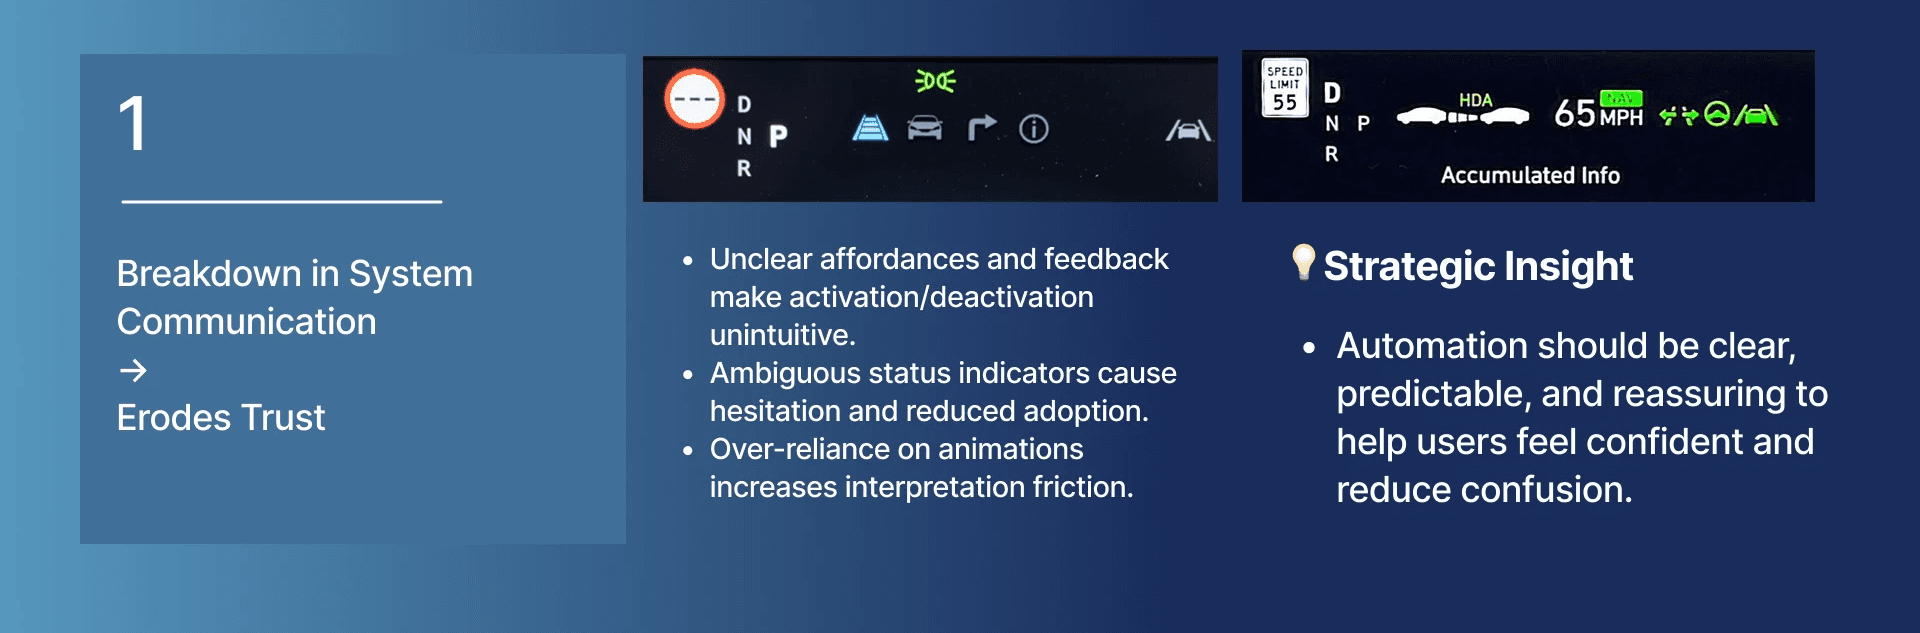
Cognitive overload from unclear visual hierarchy and system status weakened user trust.
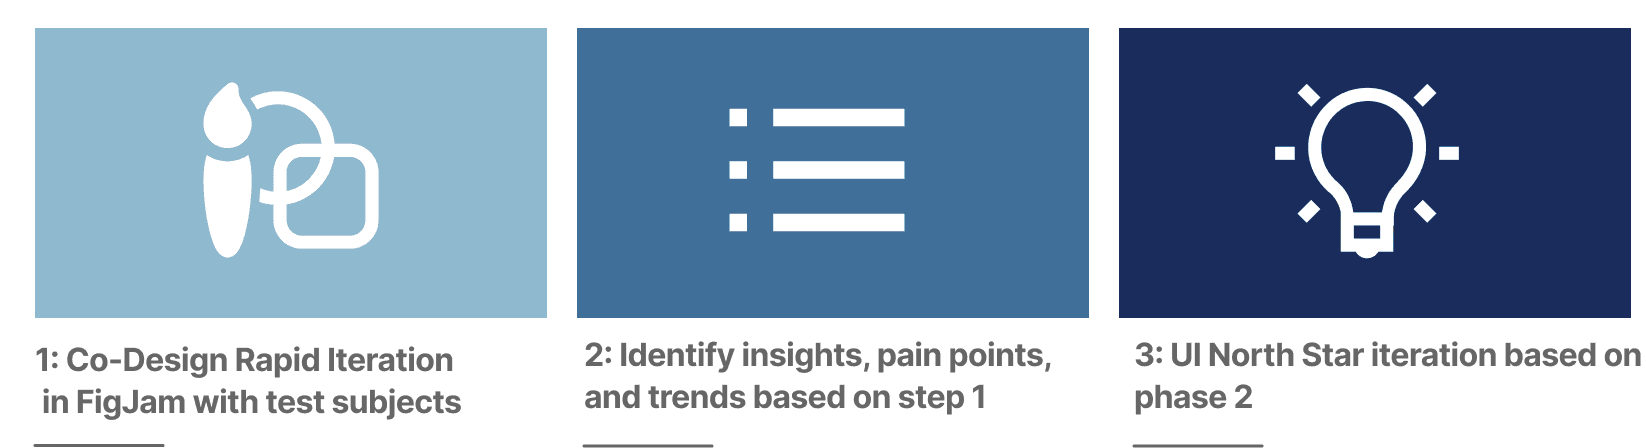
Lofi-Development
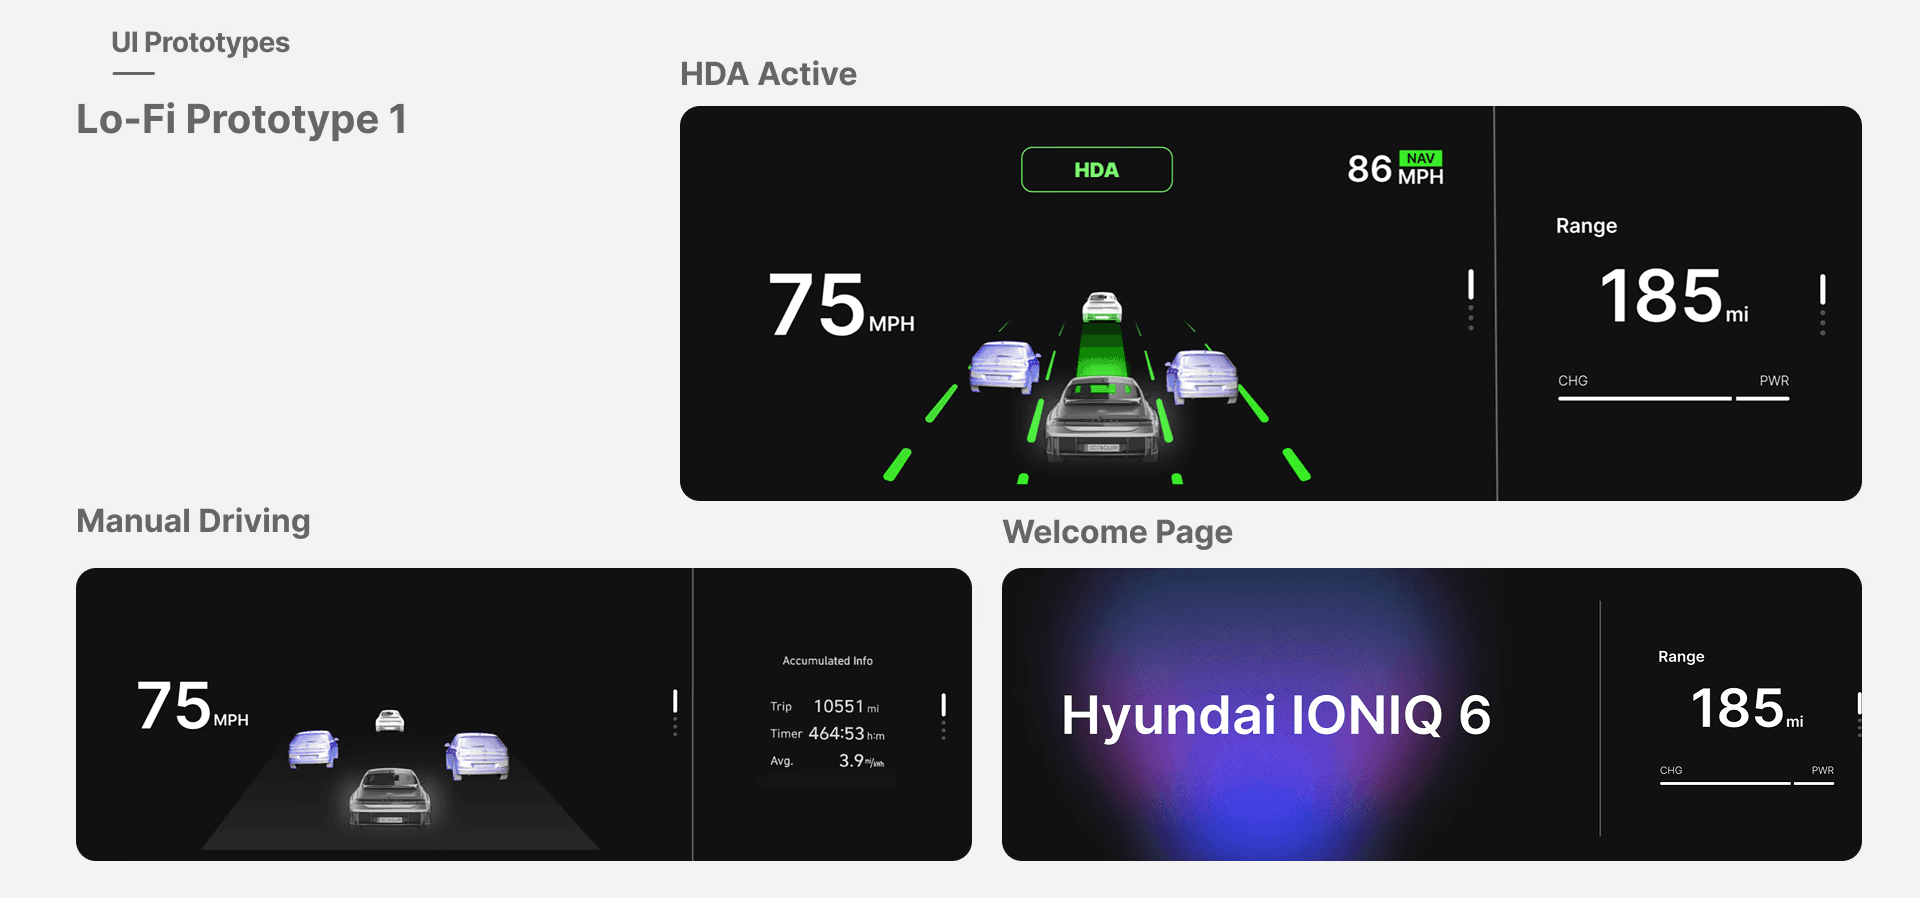
Iterations
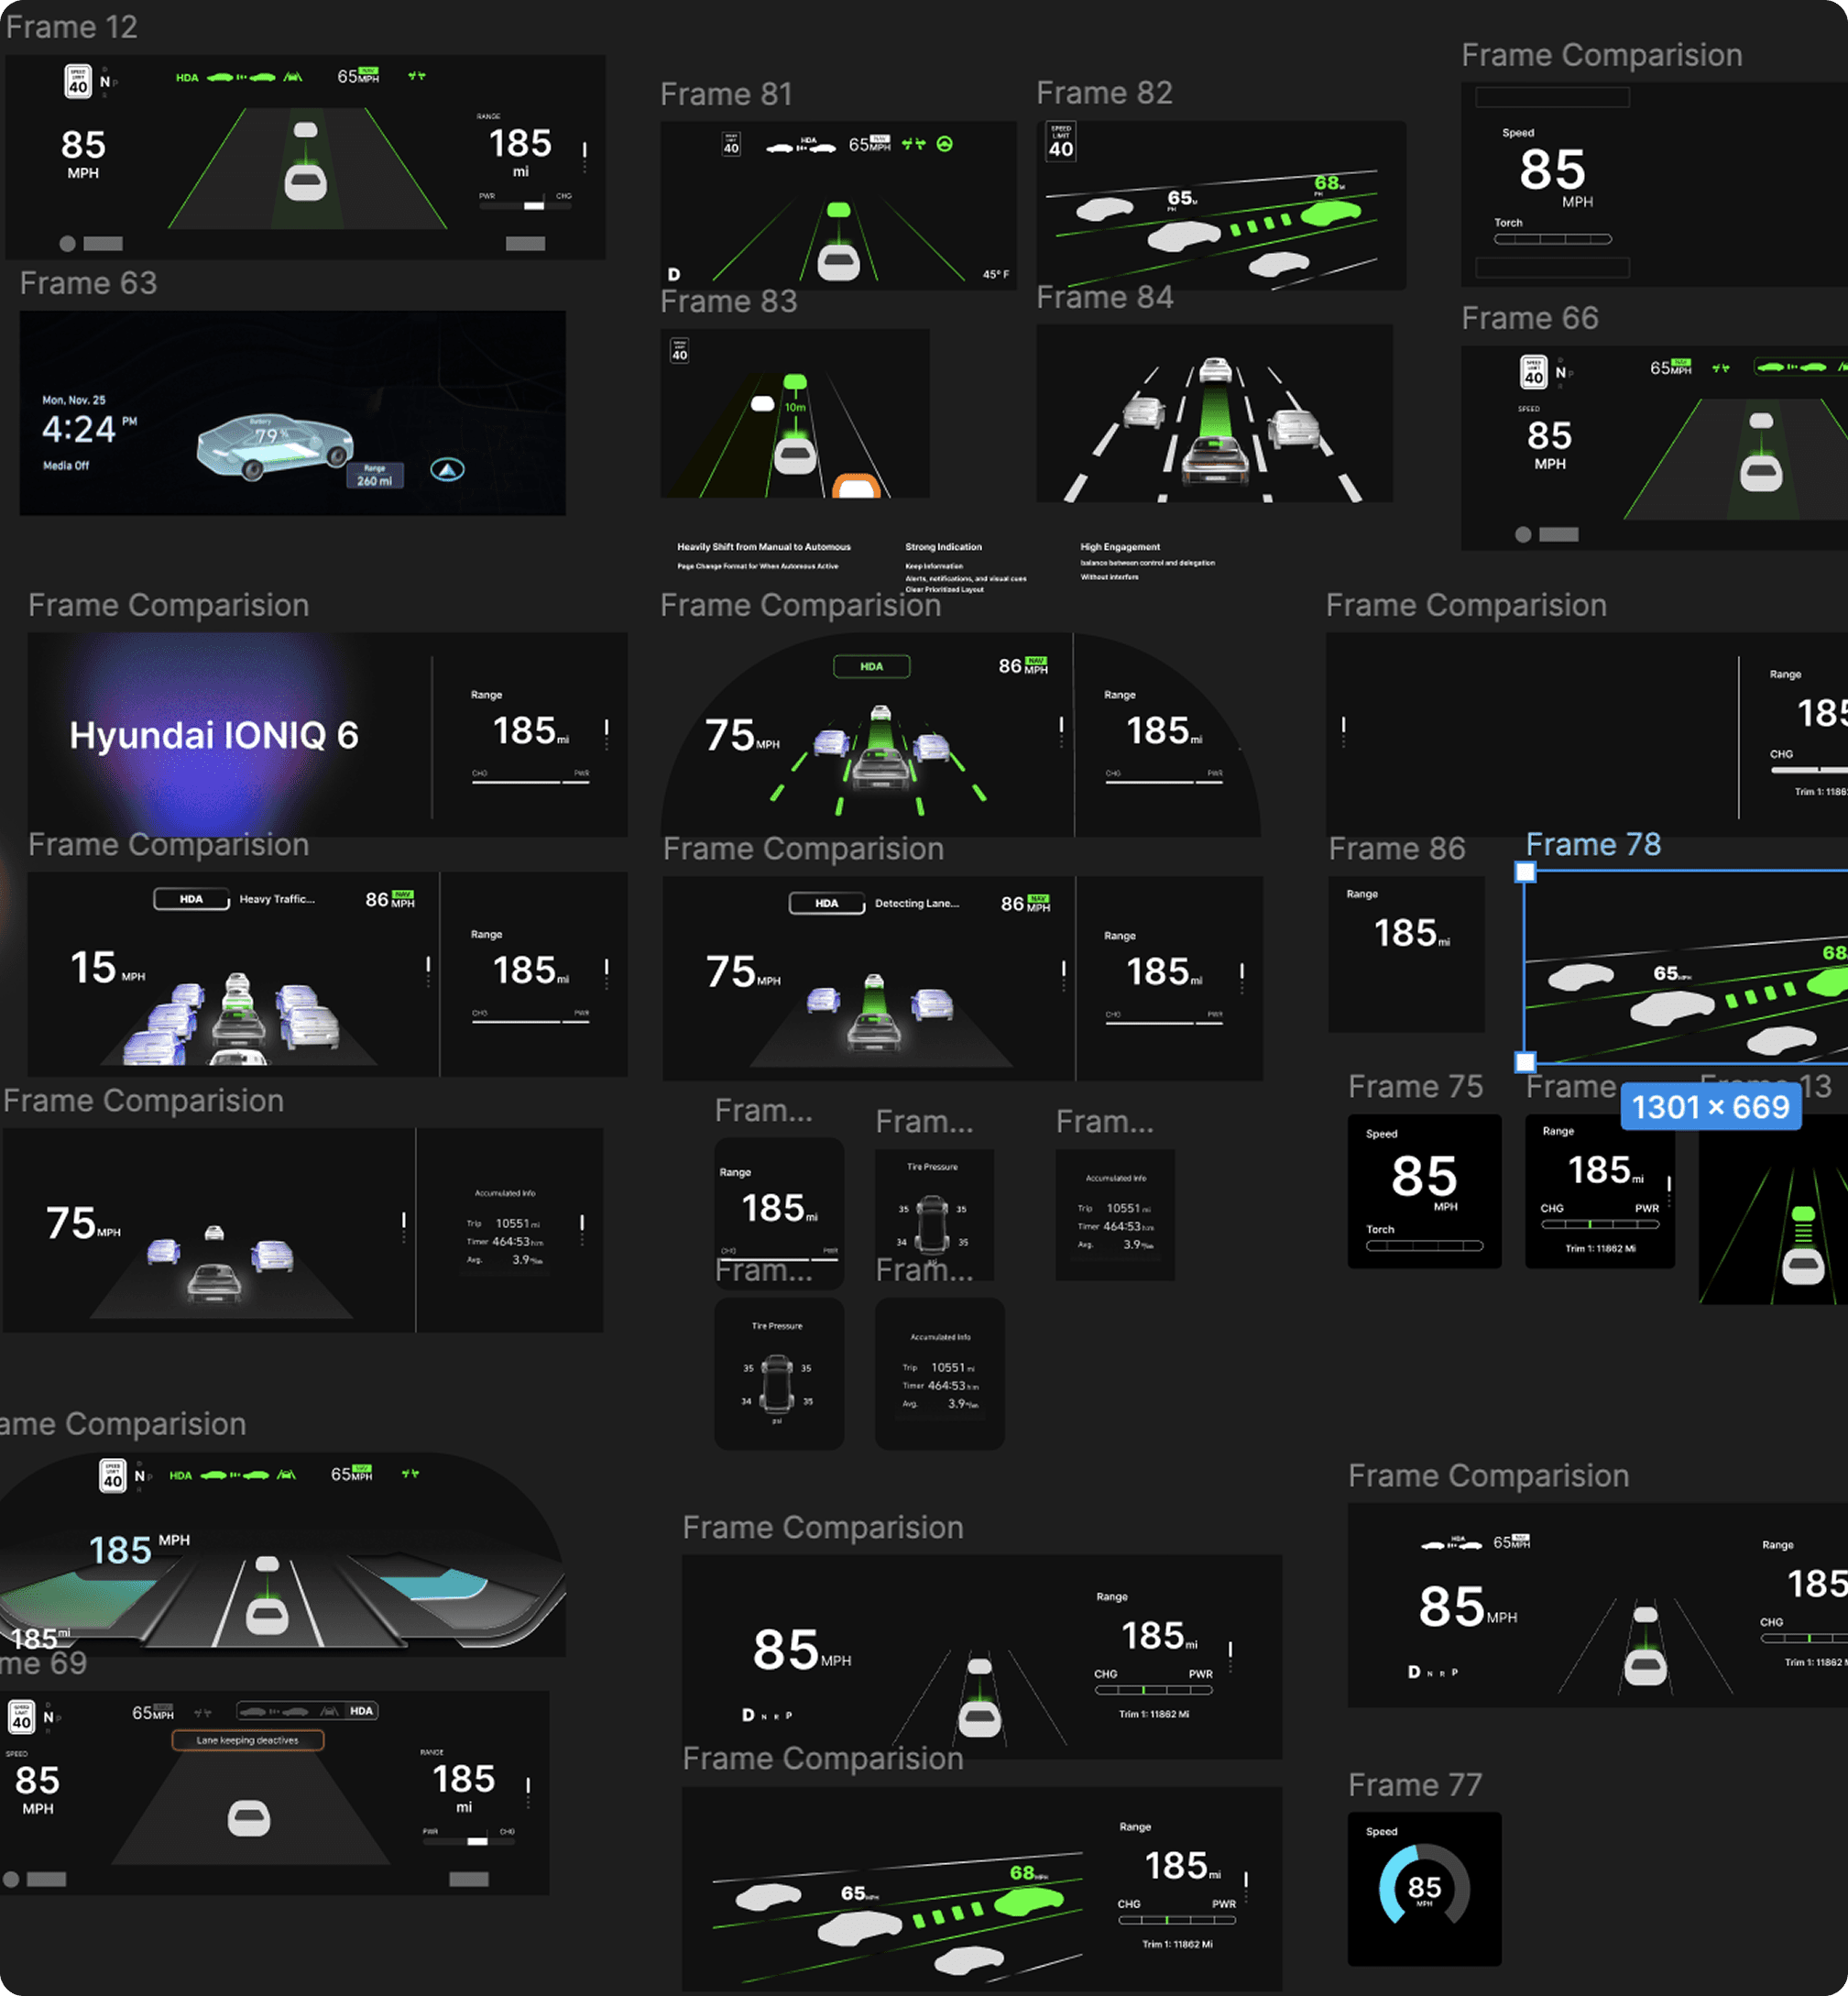
Design System
We designed and tested three UI directions:
White UI | Green UI | Blue UI |
|---|---|---|
 | 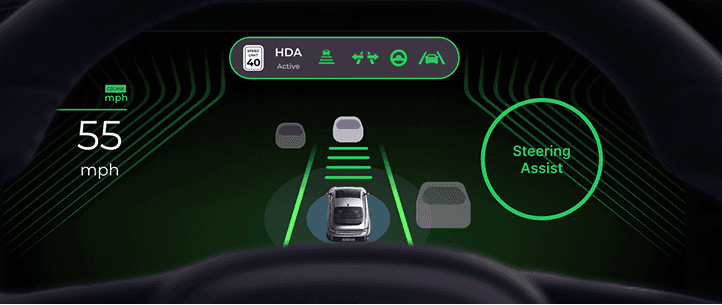 |  |
Minimal Baseline | Trust-oriented, emotionally calming | Highly technical, informative |
Round 2 Test Overview
Testing Process
UI White board Test Set up
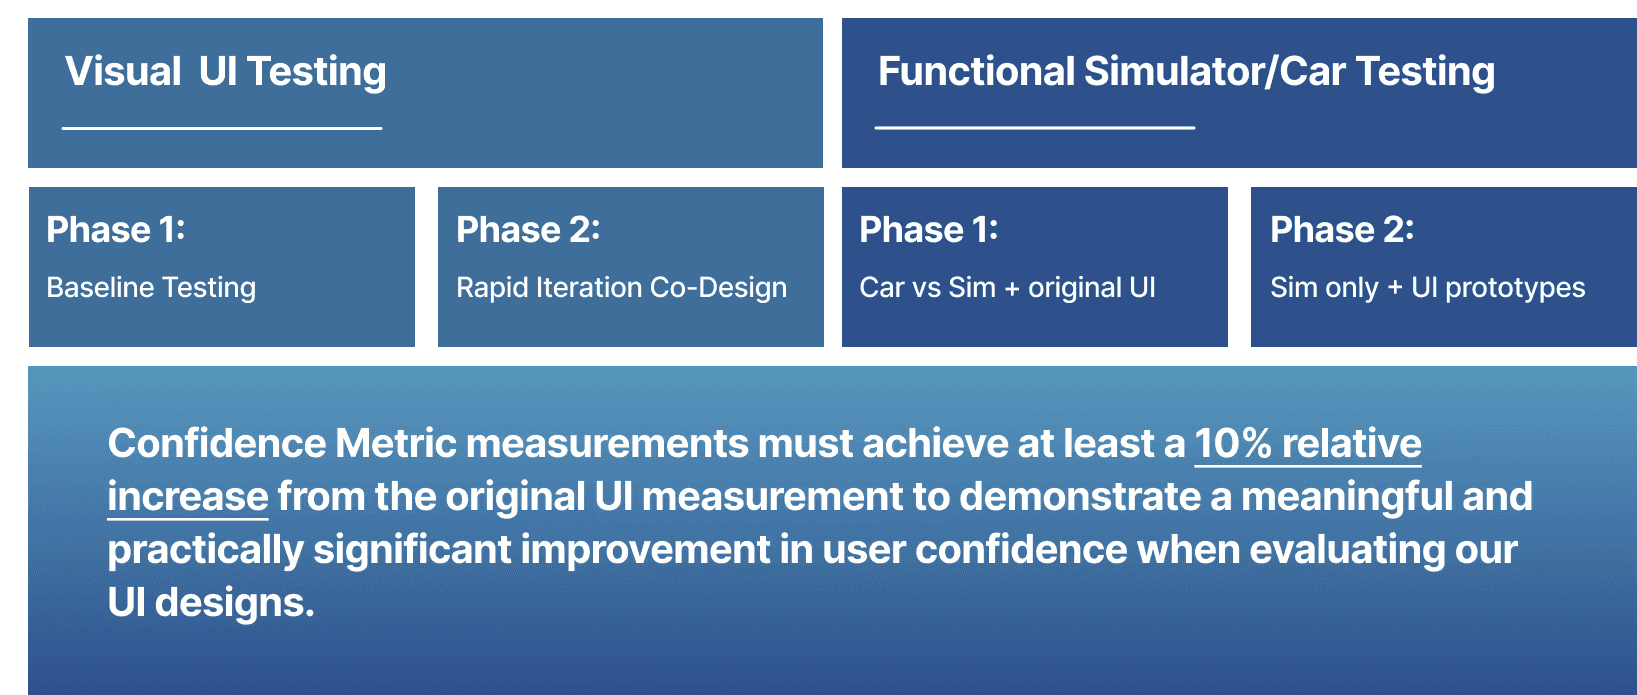
Confidence Metric System for Round 2 Test
A custom confidence metric integrated:
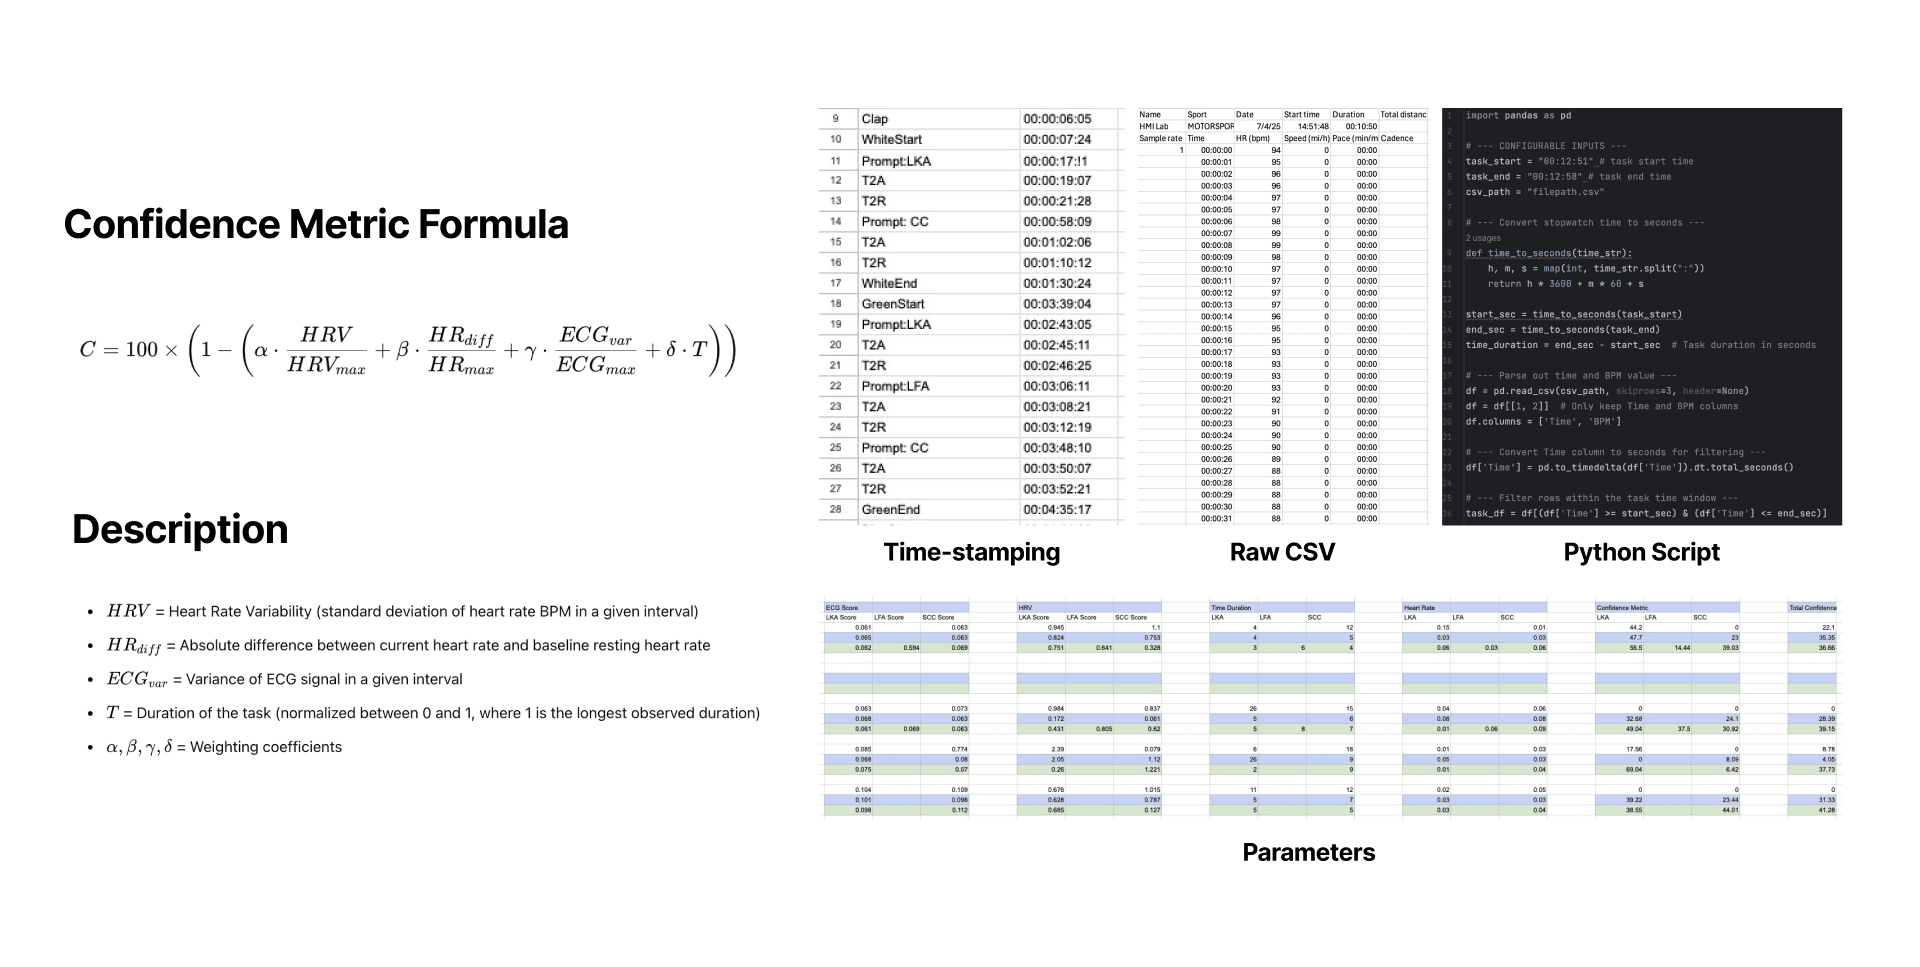
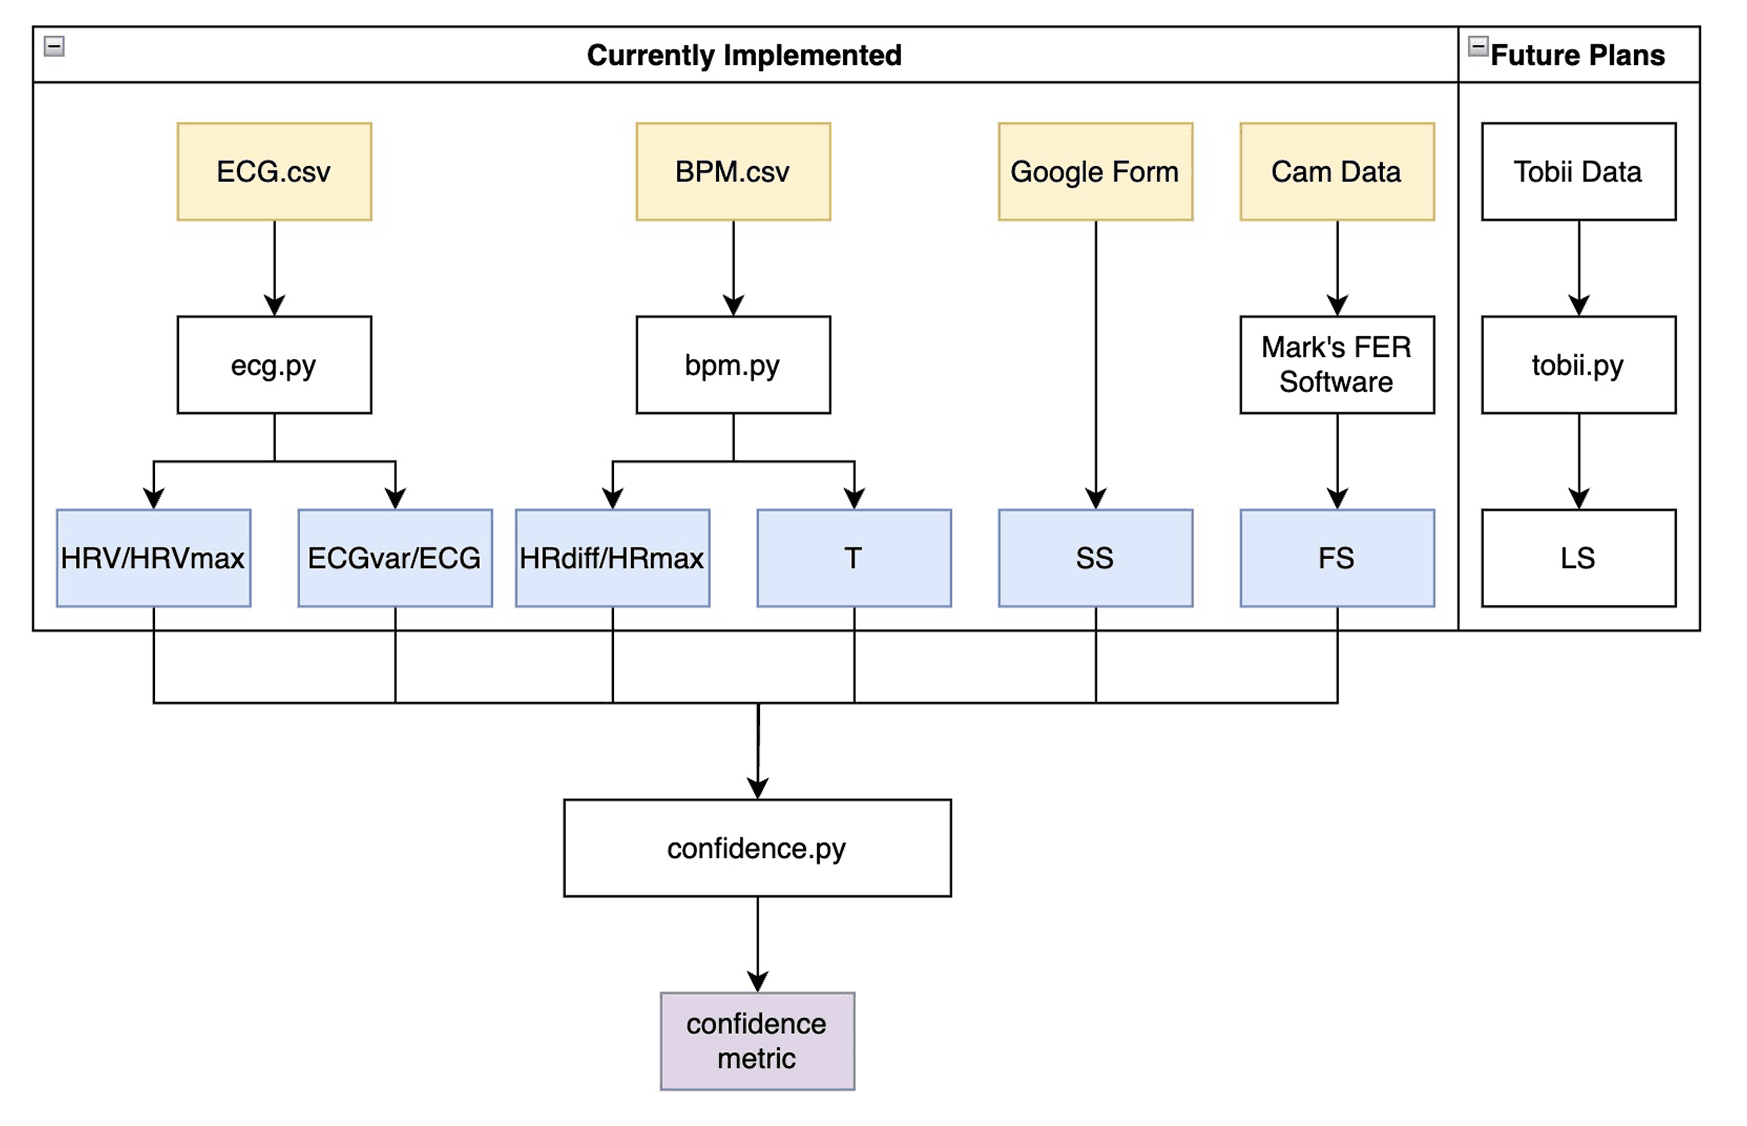
HRV (ECG)
Eye fixation variance
System trust Likert scale
Facial emotion recognition (FER)
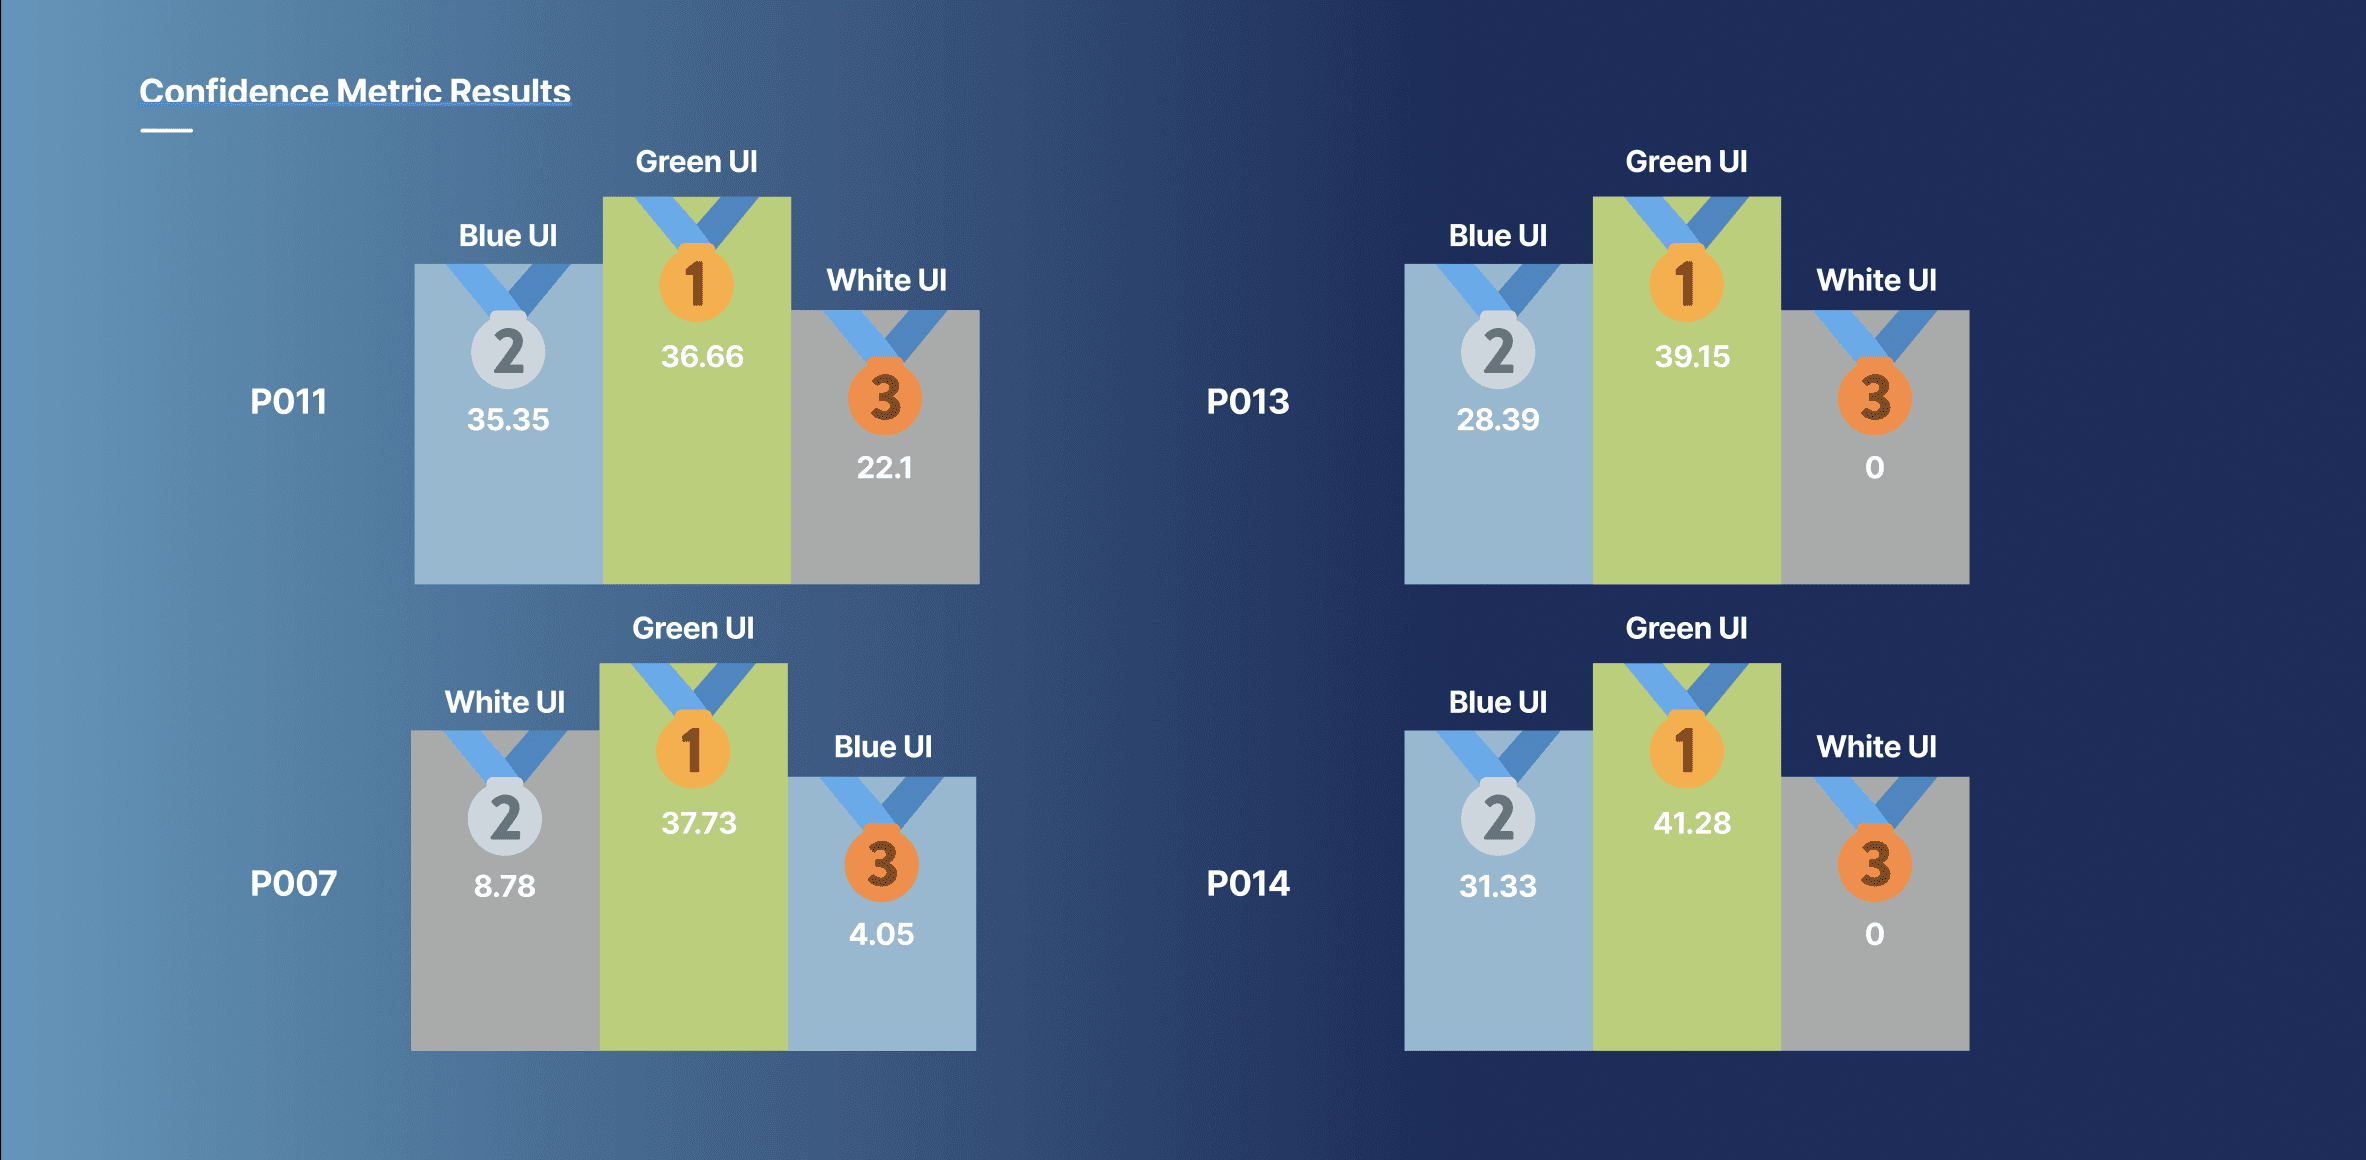
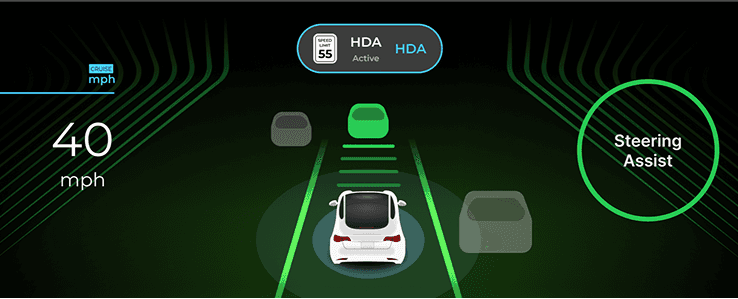
🧪 The Green UI achieved the highest confidence score (+10% improvement vs original UI).
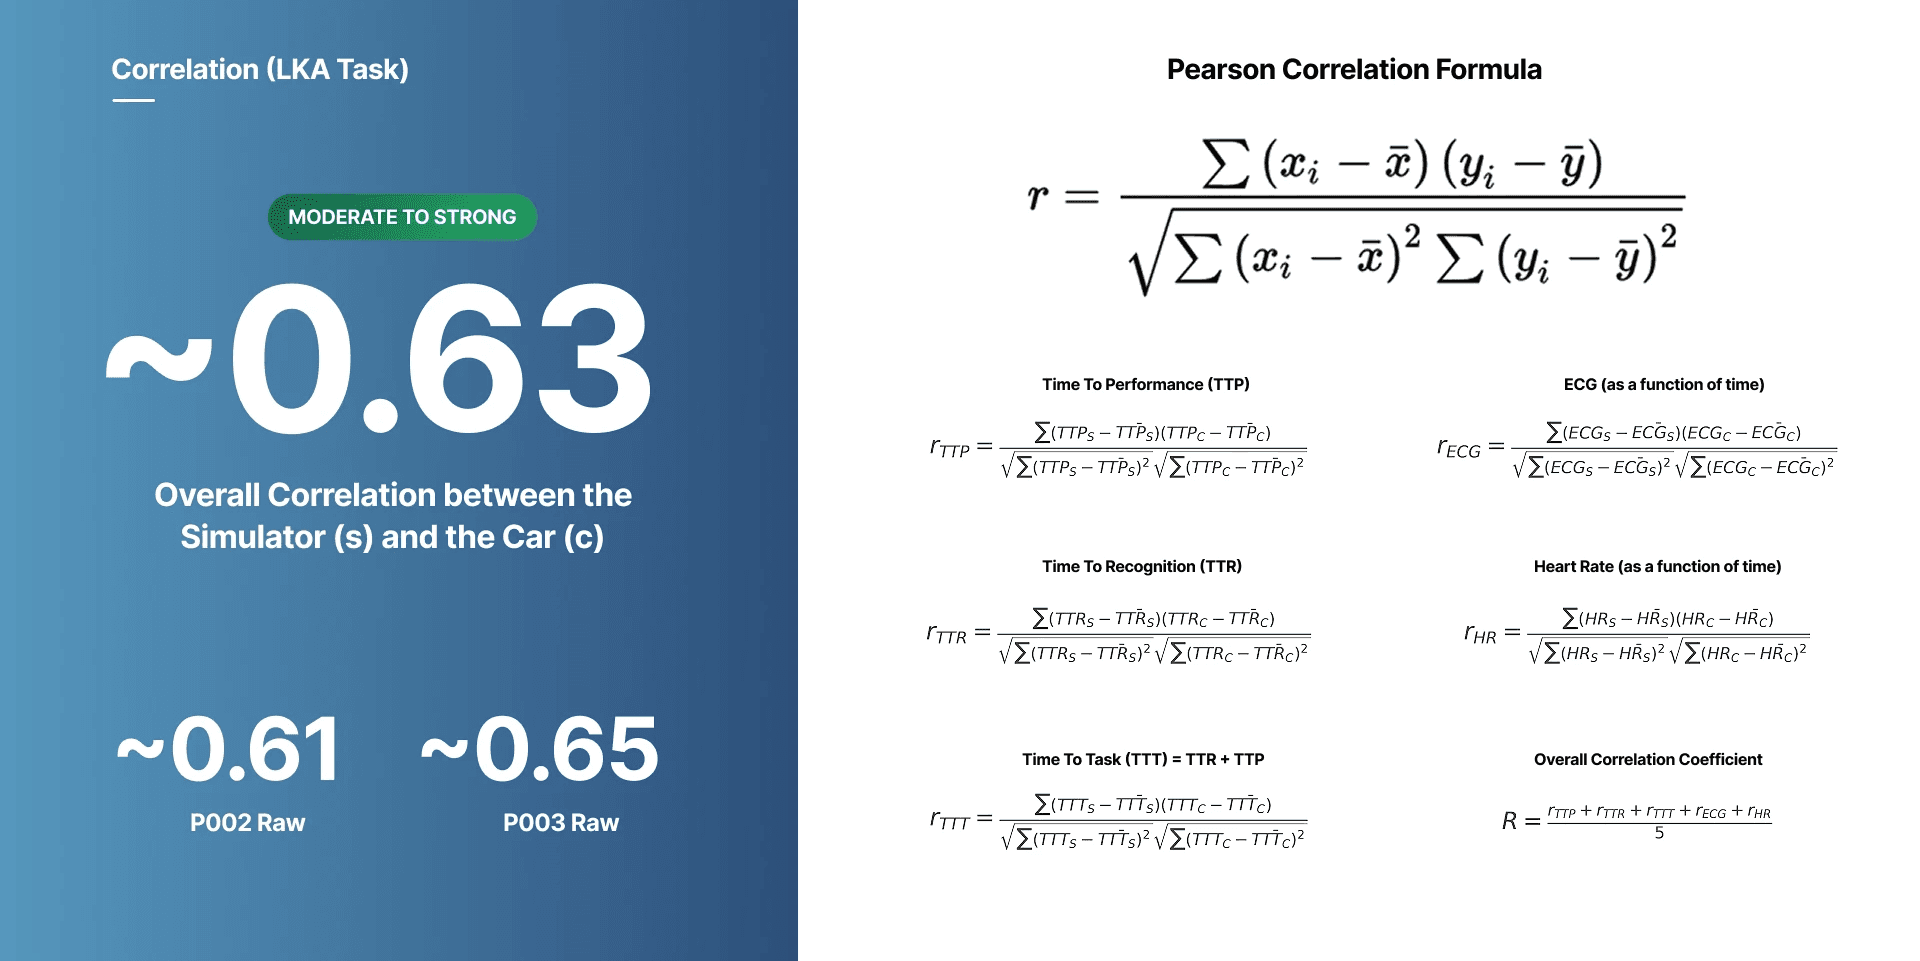
Correlation Matric
A paired-sample t-test was employed to analyze the differences between simulator and real driving conditions. This statistical method was particularly appropriate for our study design where the same participants experienced both testing environments.
Variable | Source | Purpose |
Confidence Score | Confidence Metric | Measures user certainty and comfort |
UX Self-Report | NCustom UI Questionnaire | Assesses usability, clarity, and satisfaction |
Pupil Size | Tobii Pro Glasses 2 | Indicates cognitive load |
HRV (RMSSD) | Polar Beat ECG | Reflects physiological stress & cognitive load |
Task Time | Interaction Logs (Sim/Real) | Evaluates UI speed & friction |
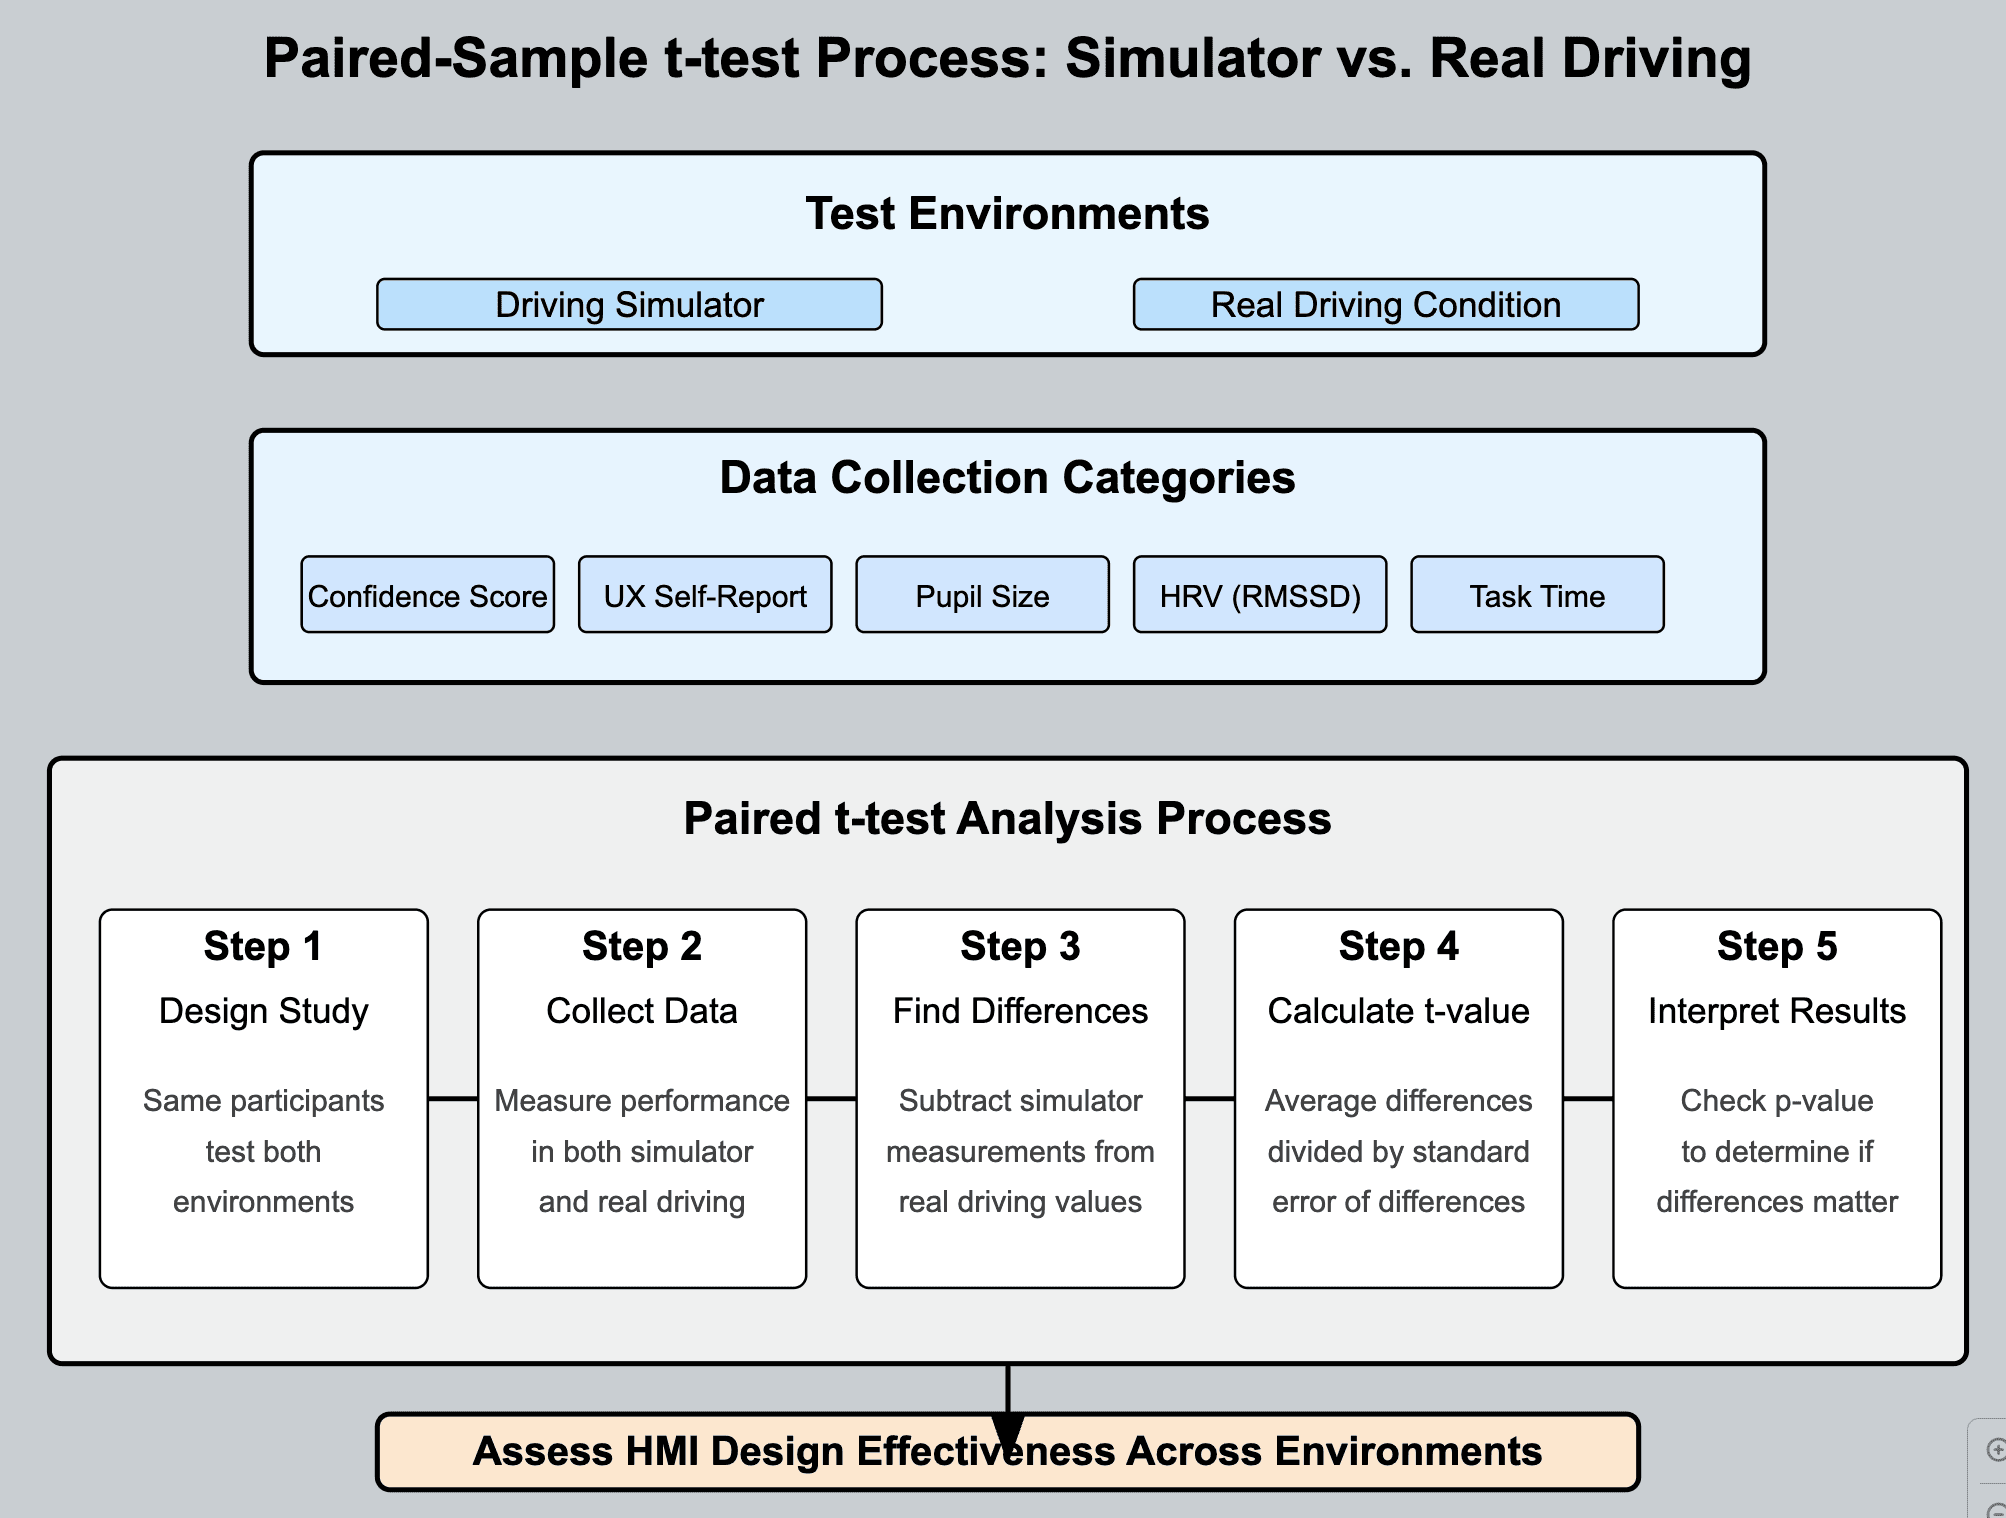
Result: Statistically significant correlation between sim and real driving confirmed validity.
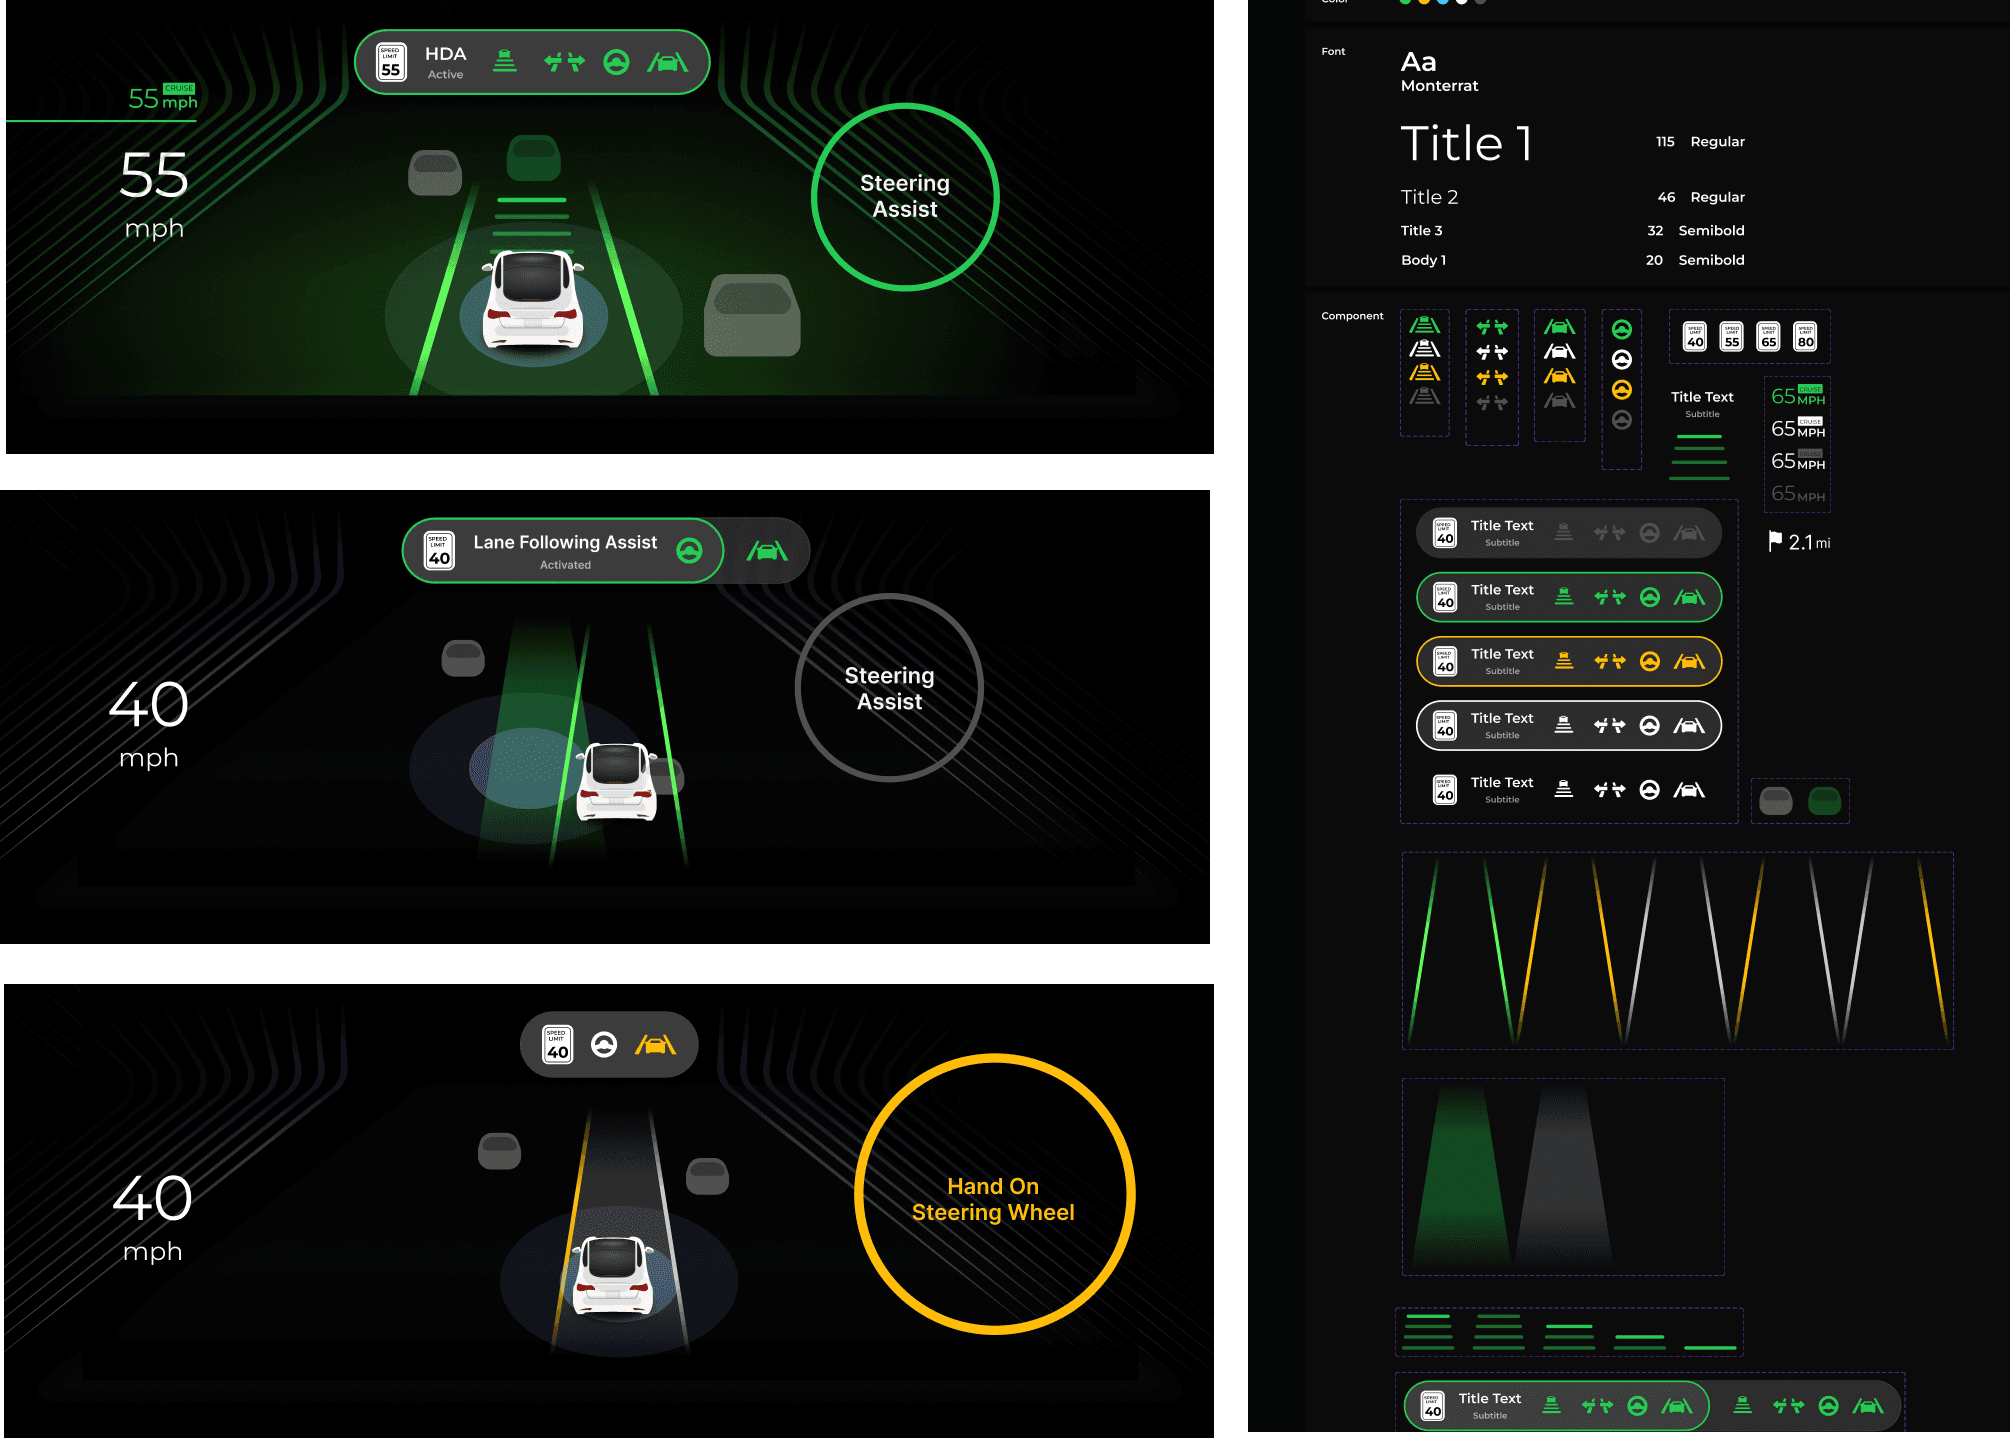
Final Solution
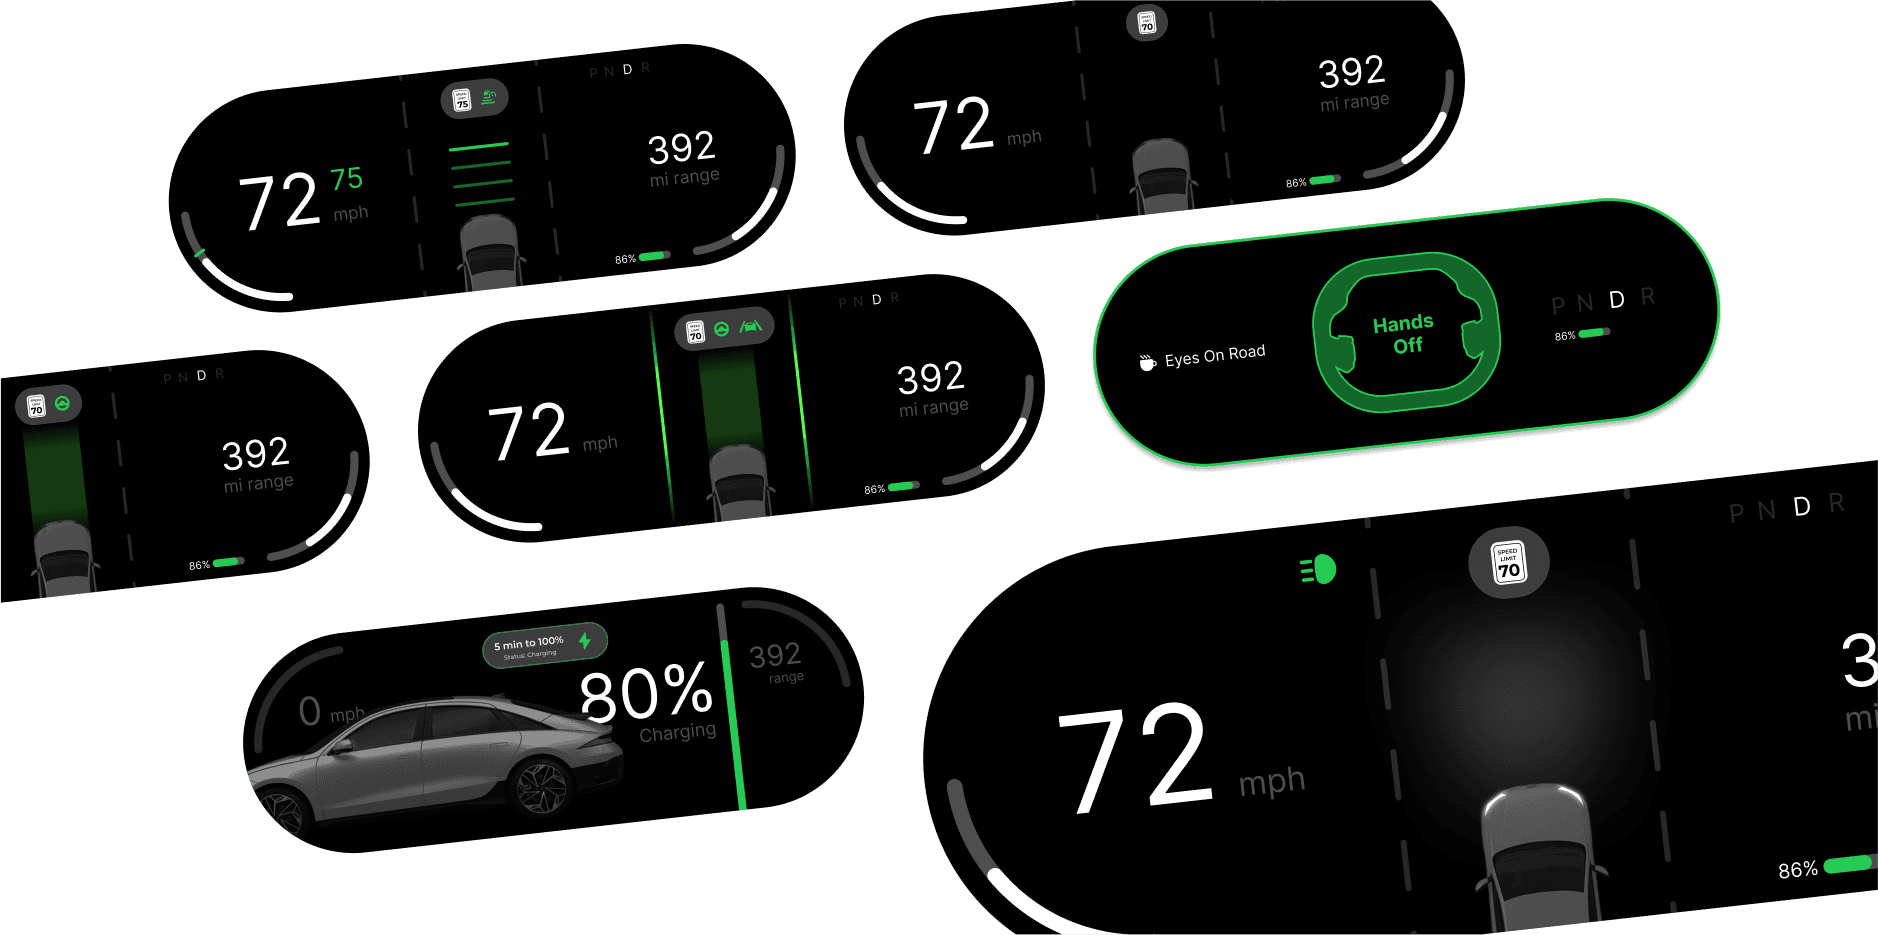
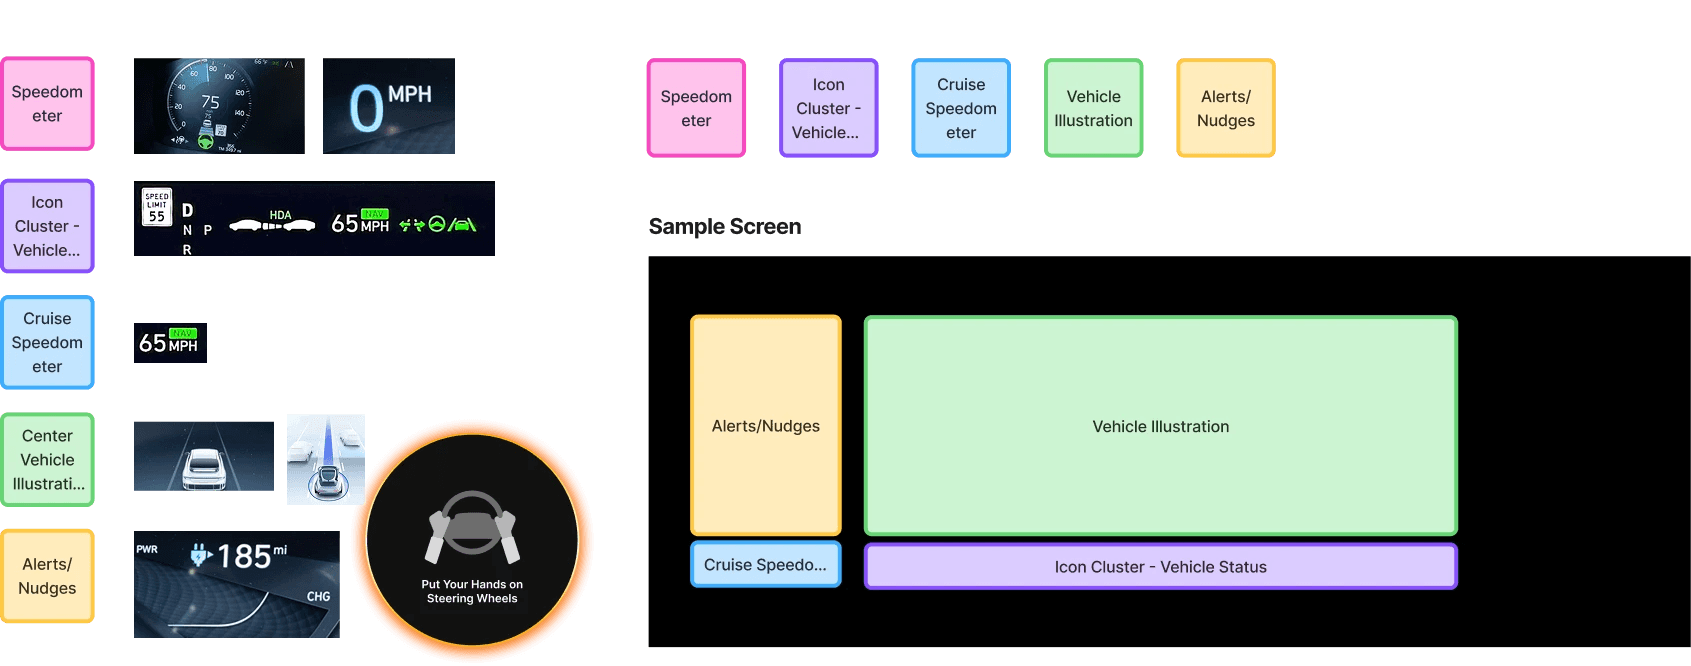
UI Final Prototype - Components
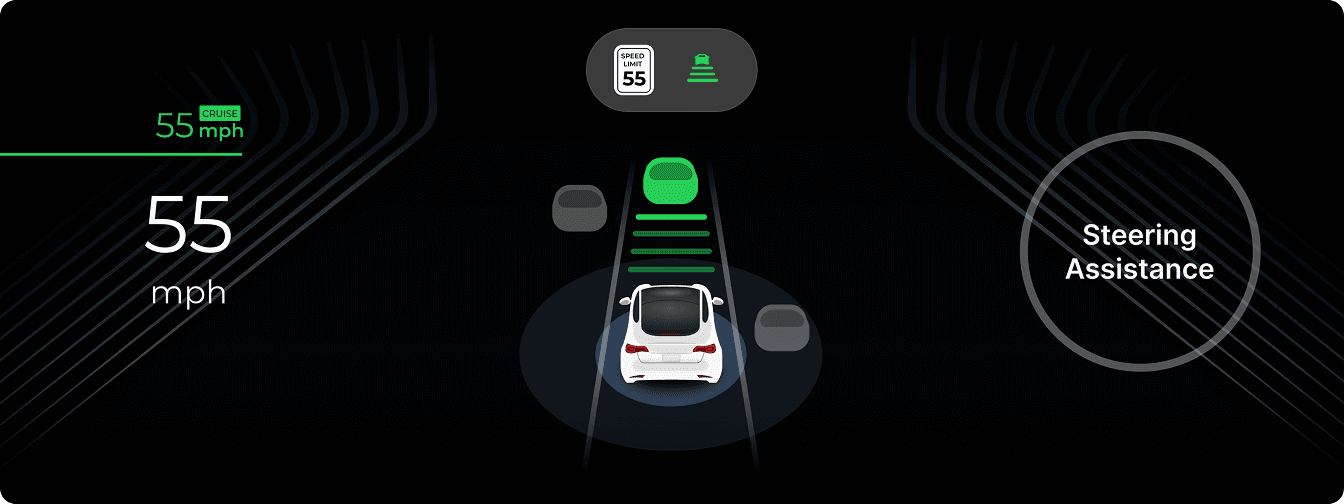
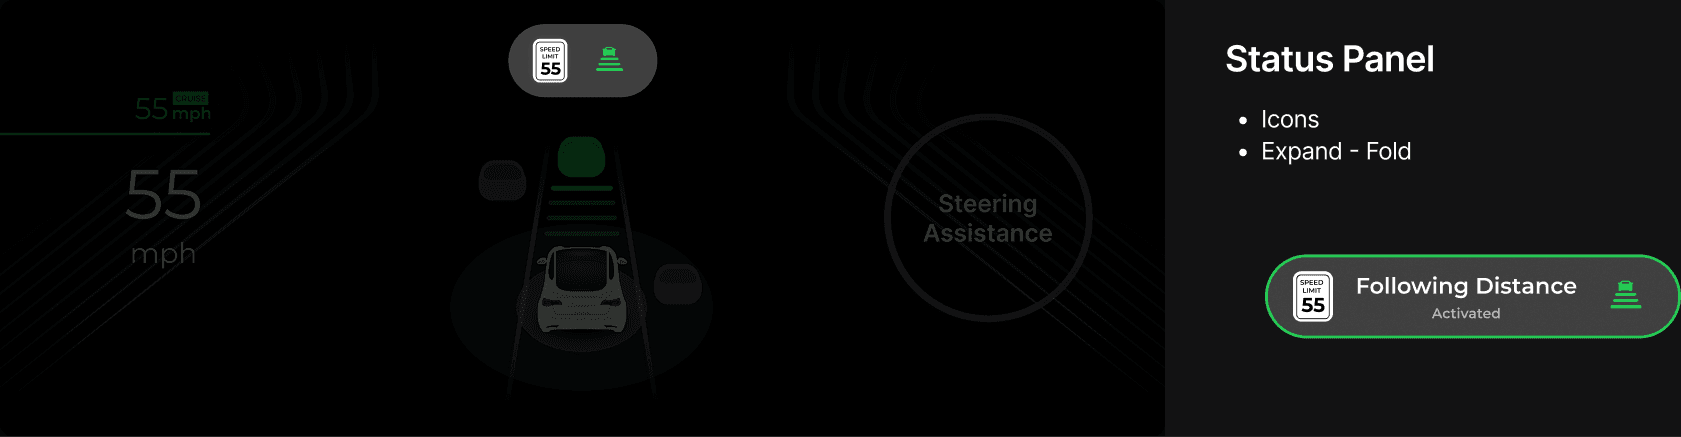
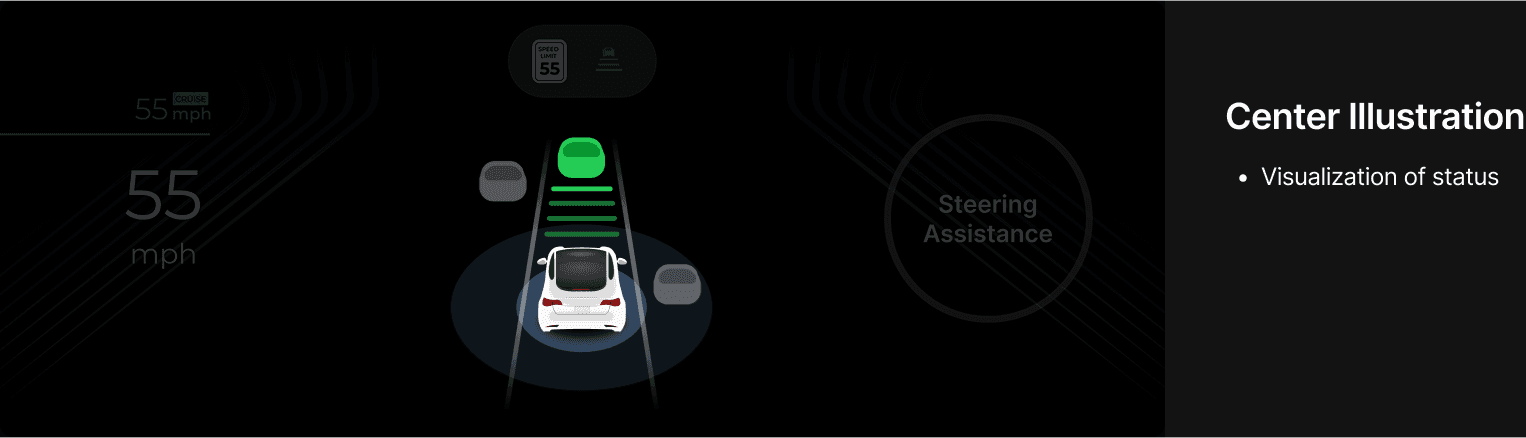
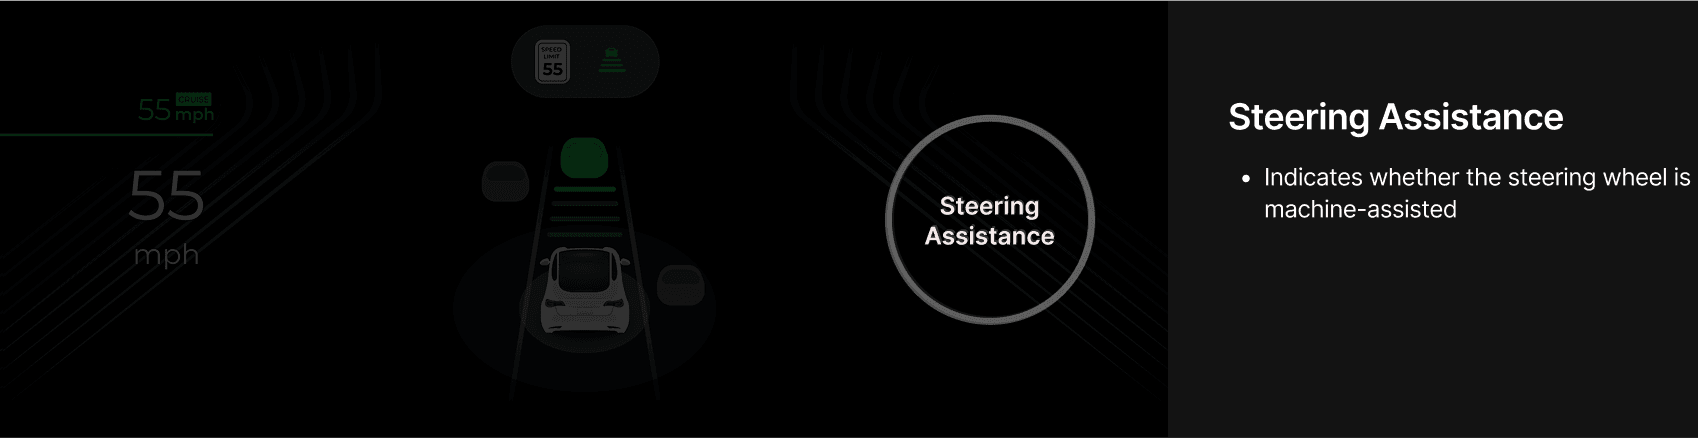
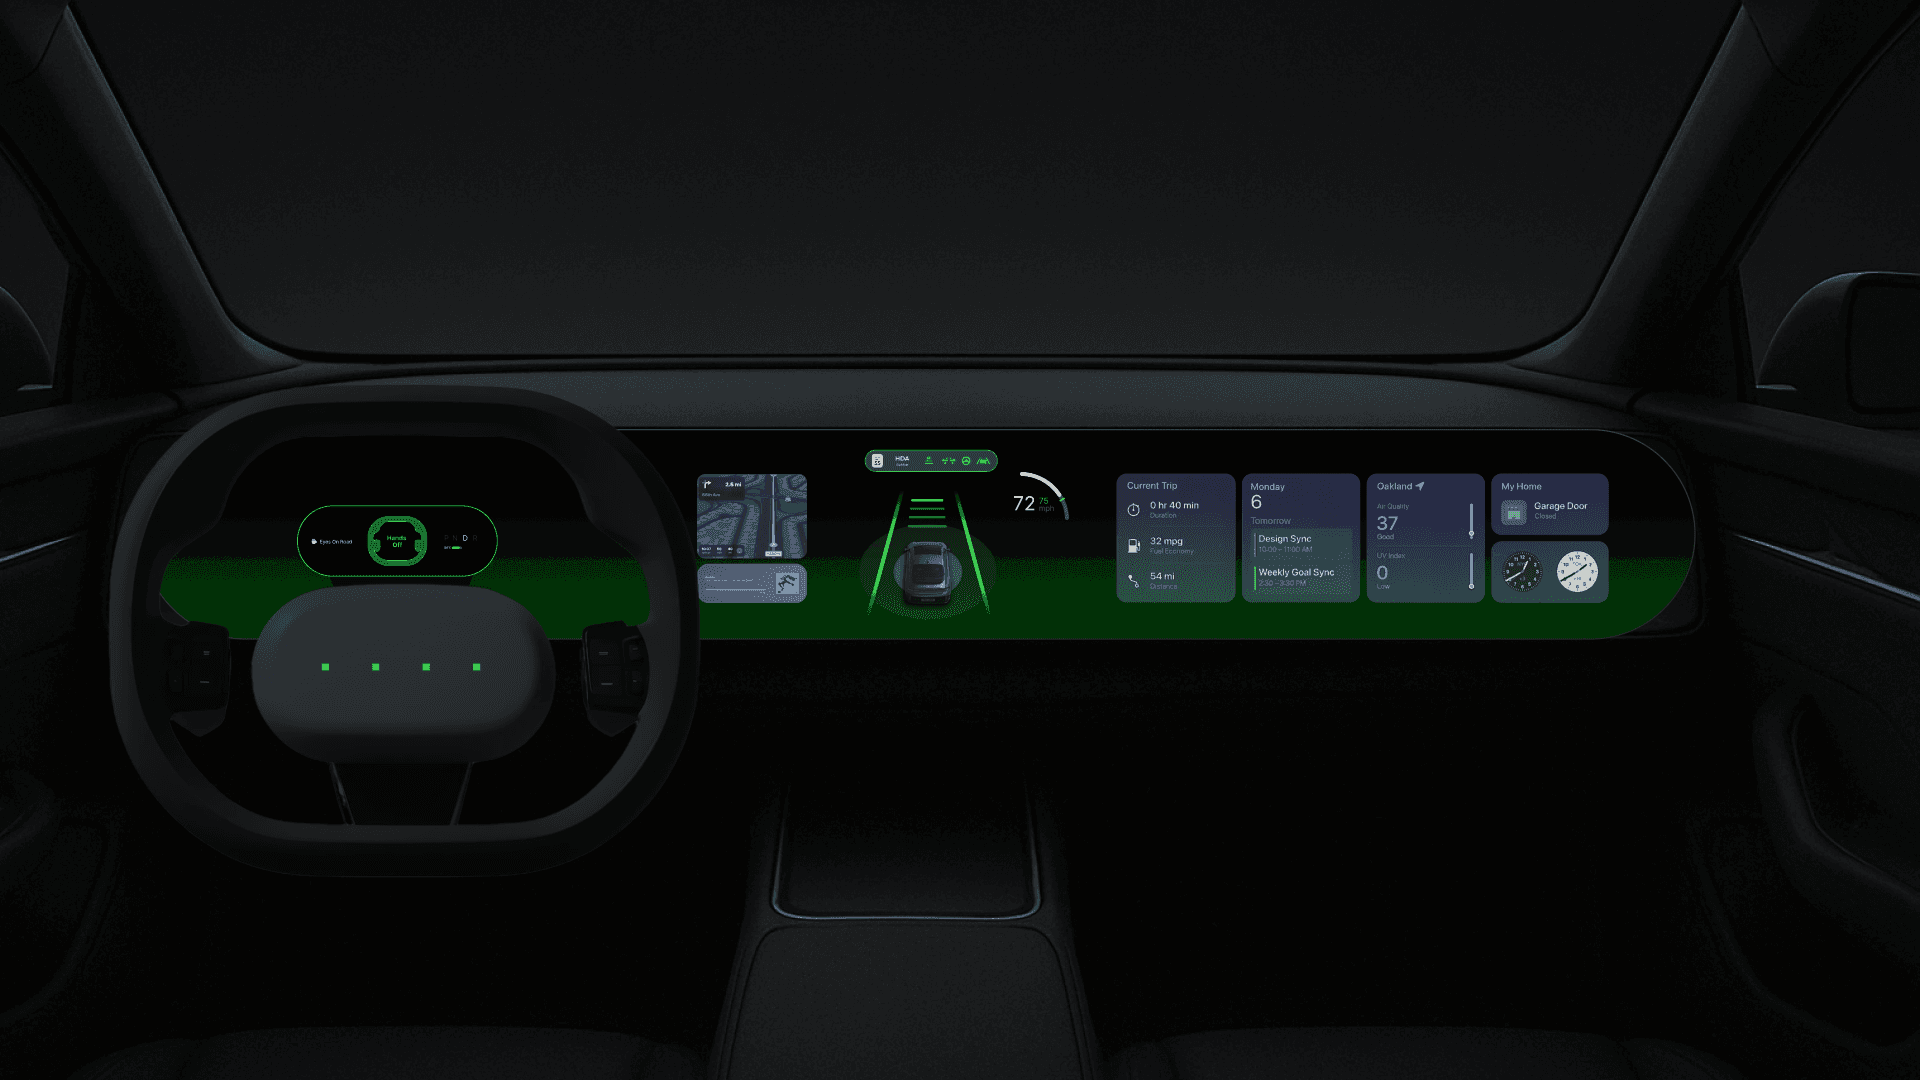
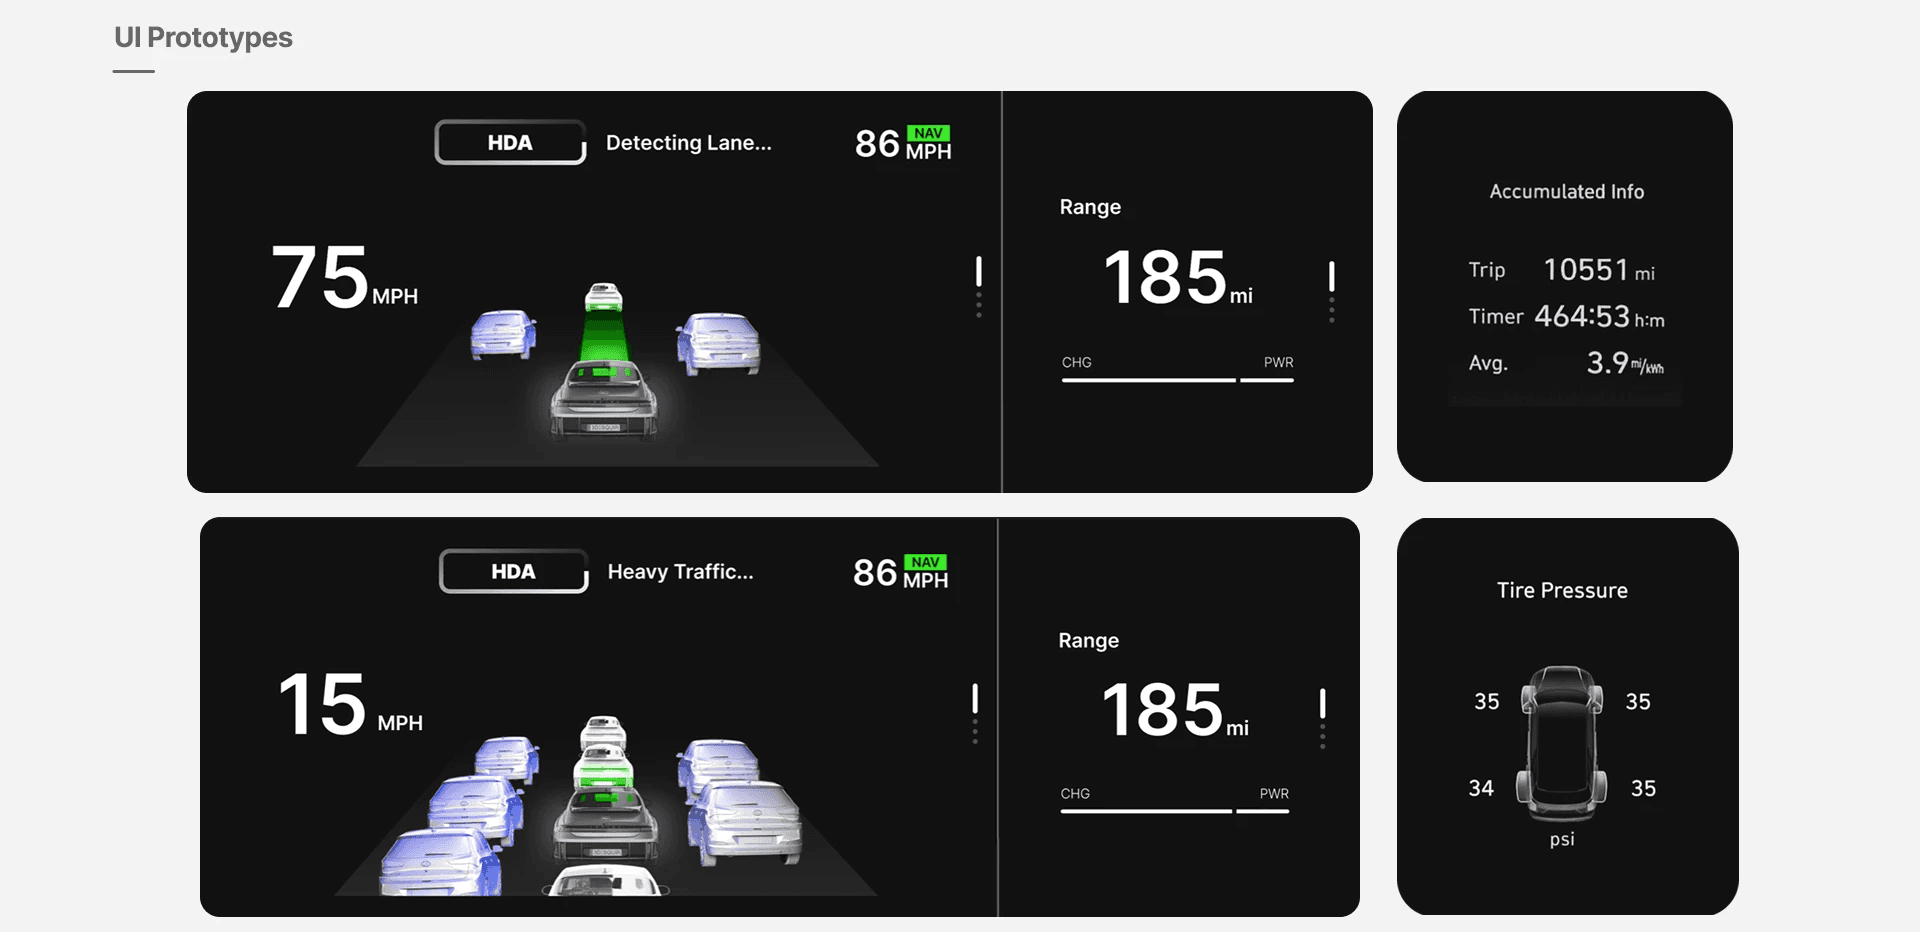
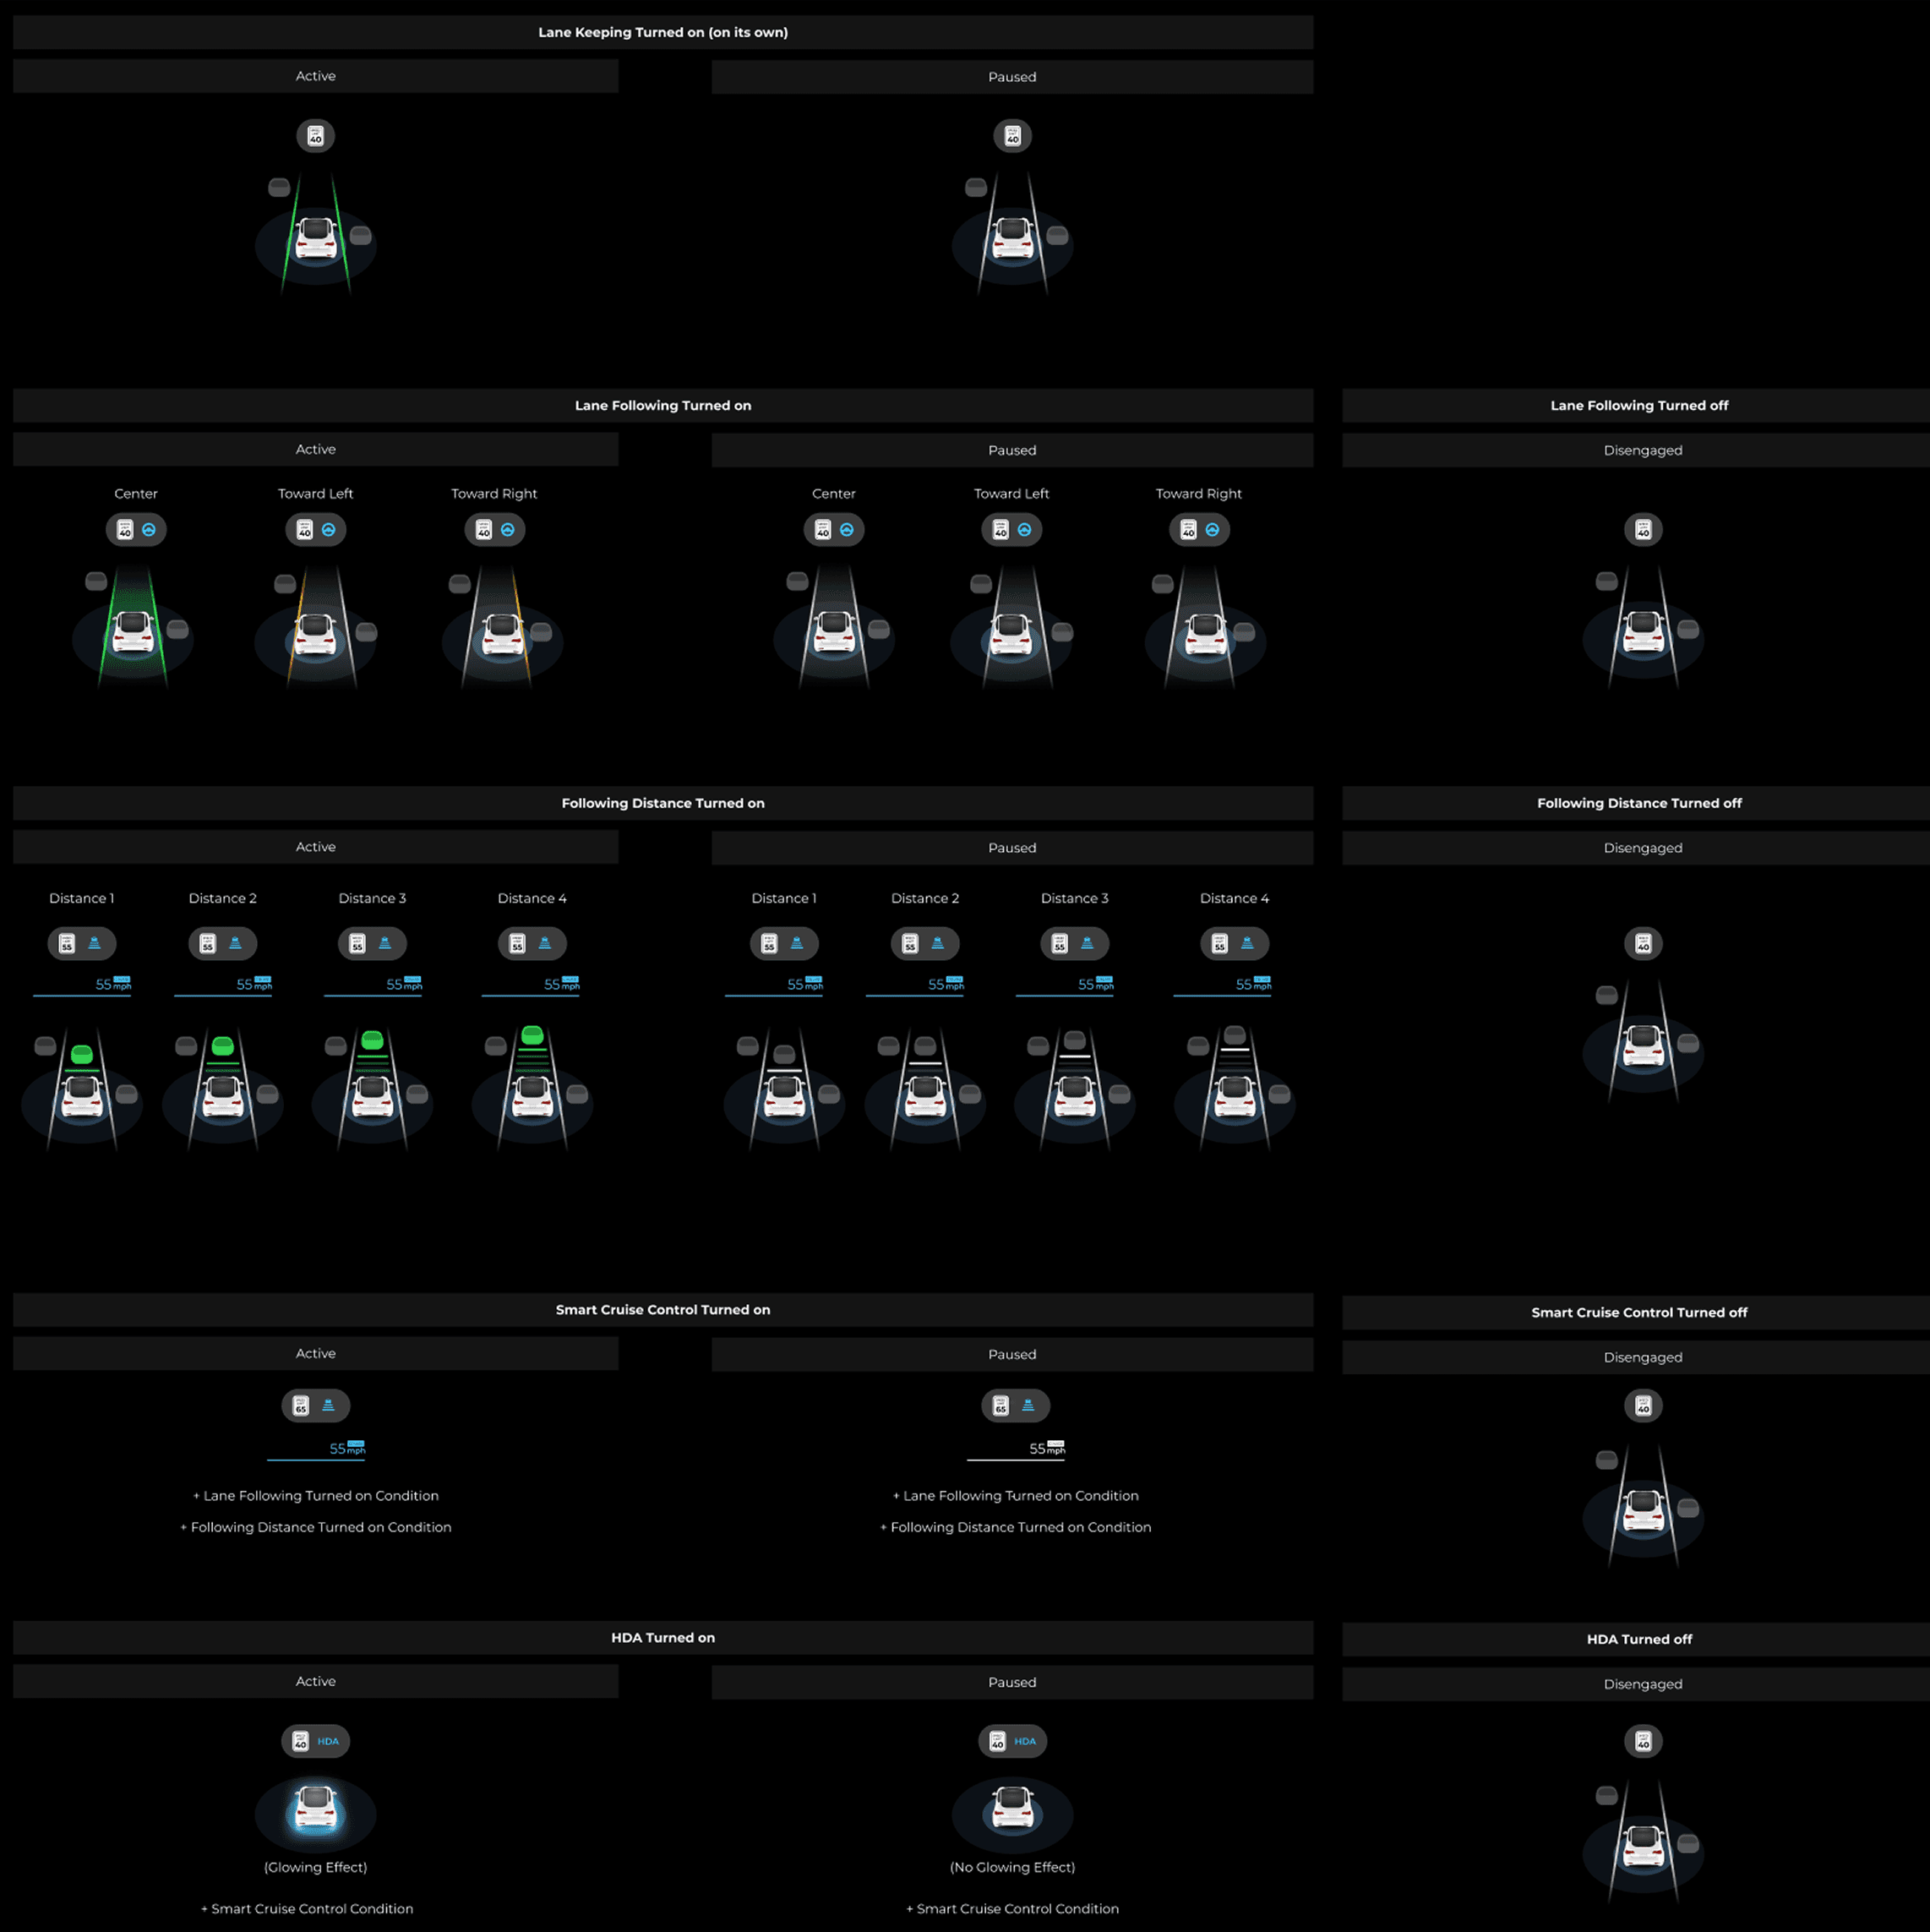
🟢 Green UI Highlights:
Dynamic icon feedback (paused vs active states)
Adaptive info density depending on driving mode
High-contrast lane keeping + distance follow alerts
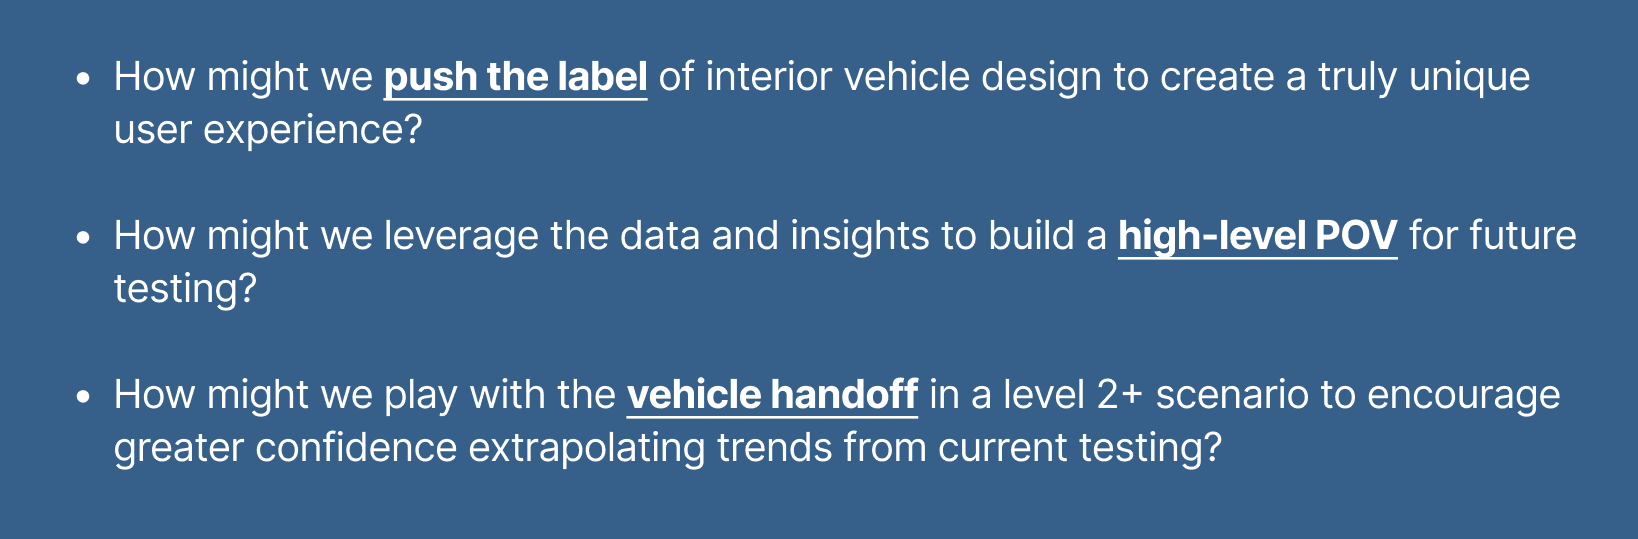
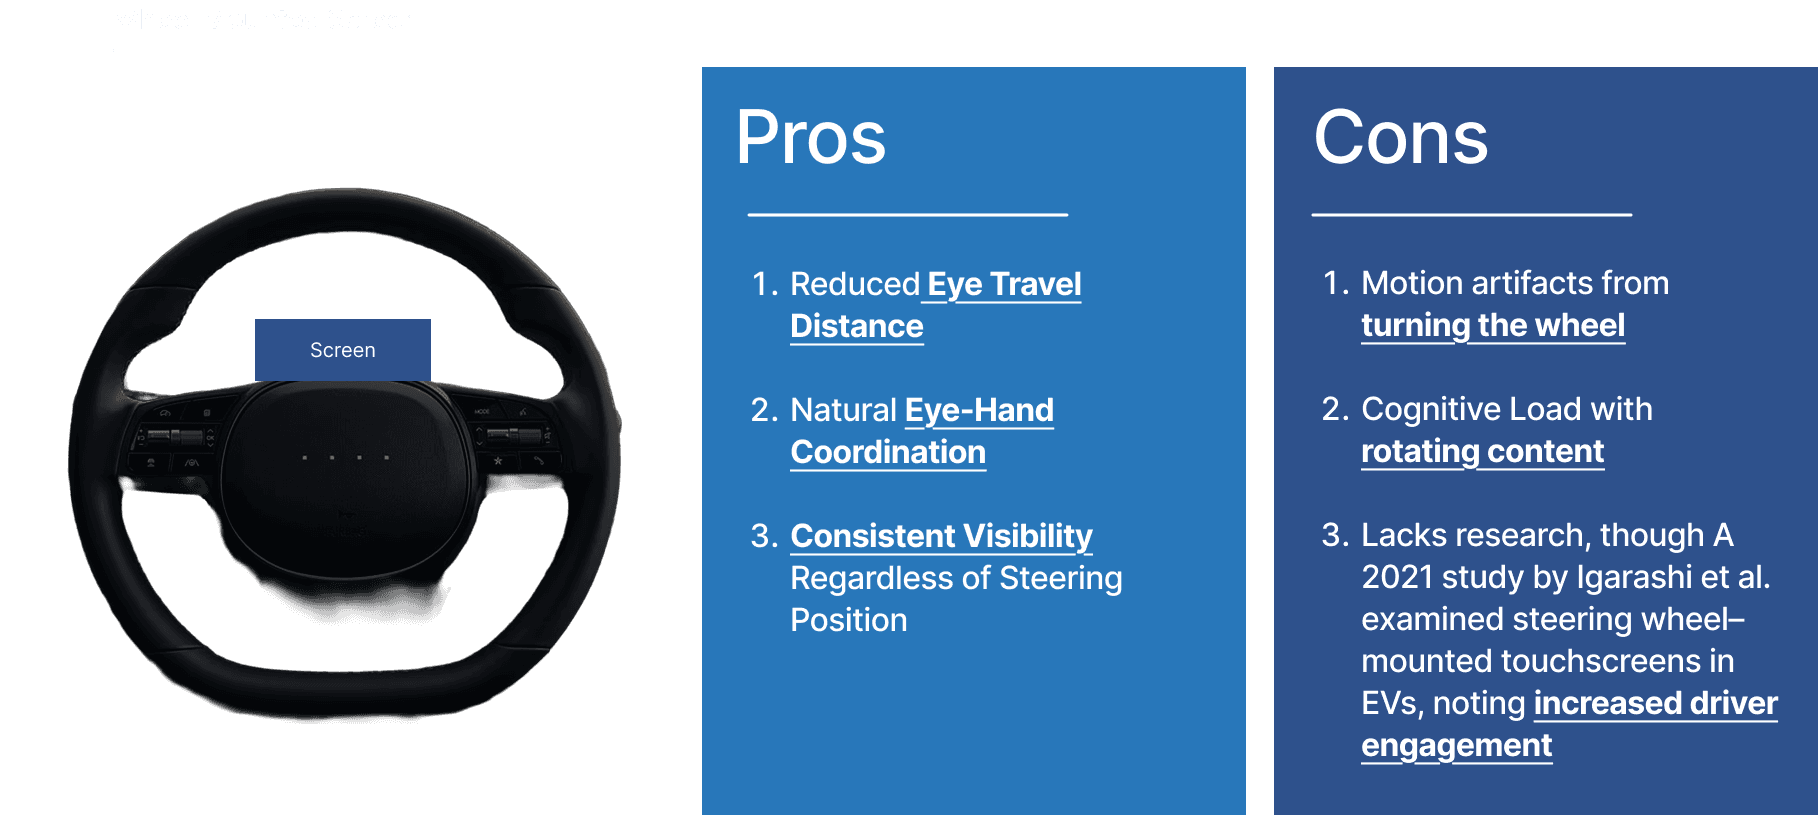
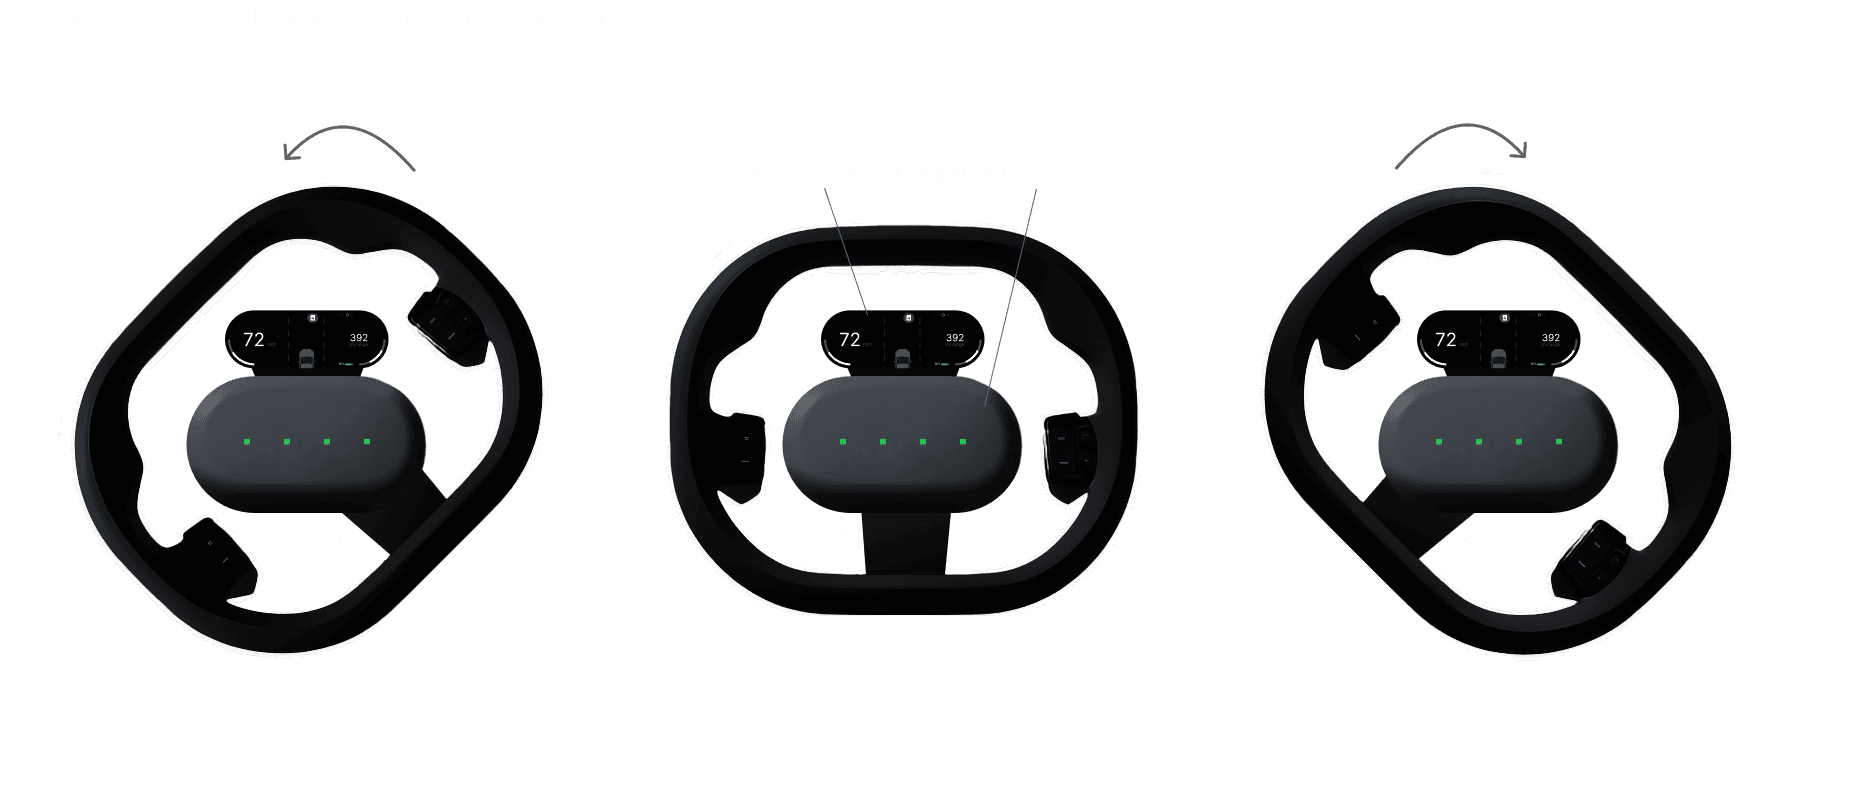
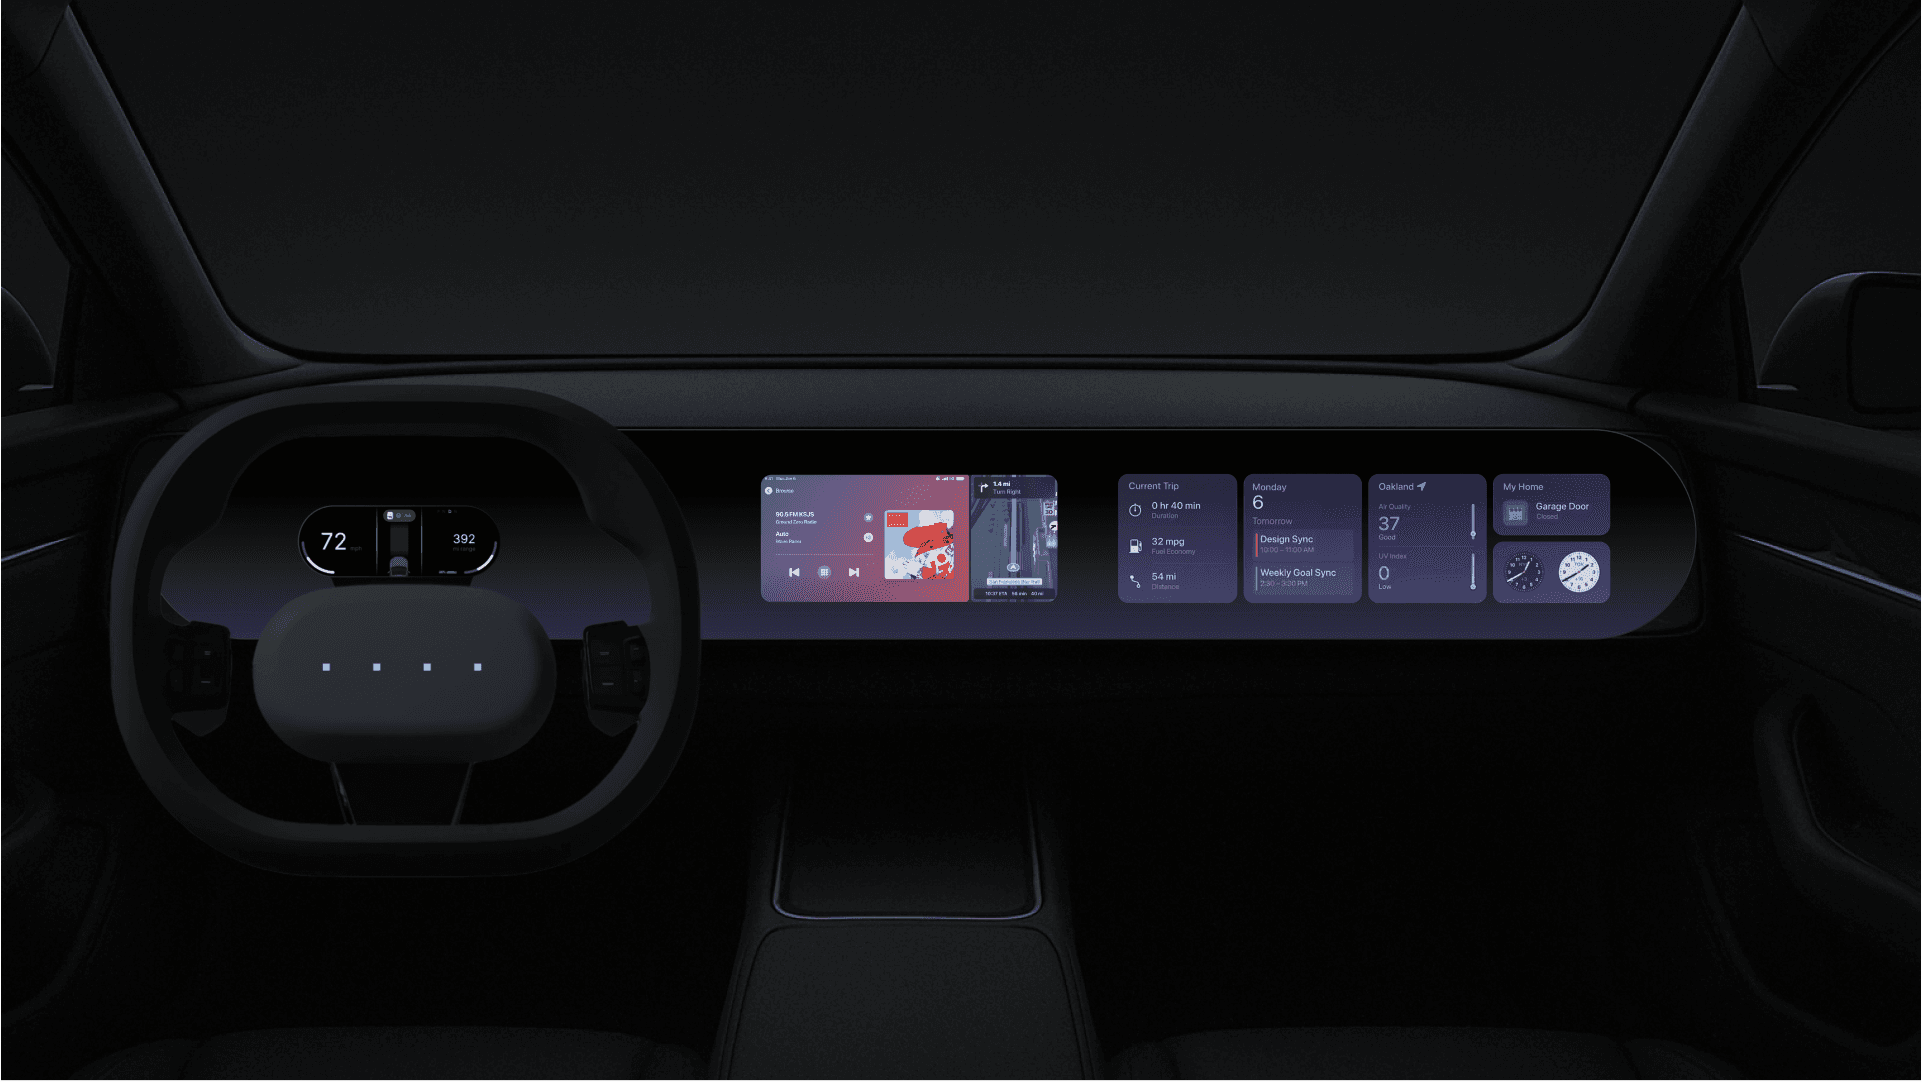
Steering wheel-mounted screen prototype (North Star)
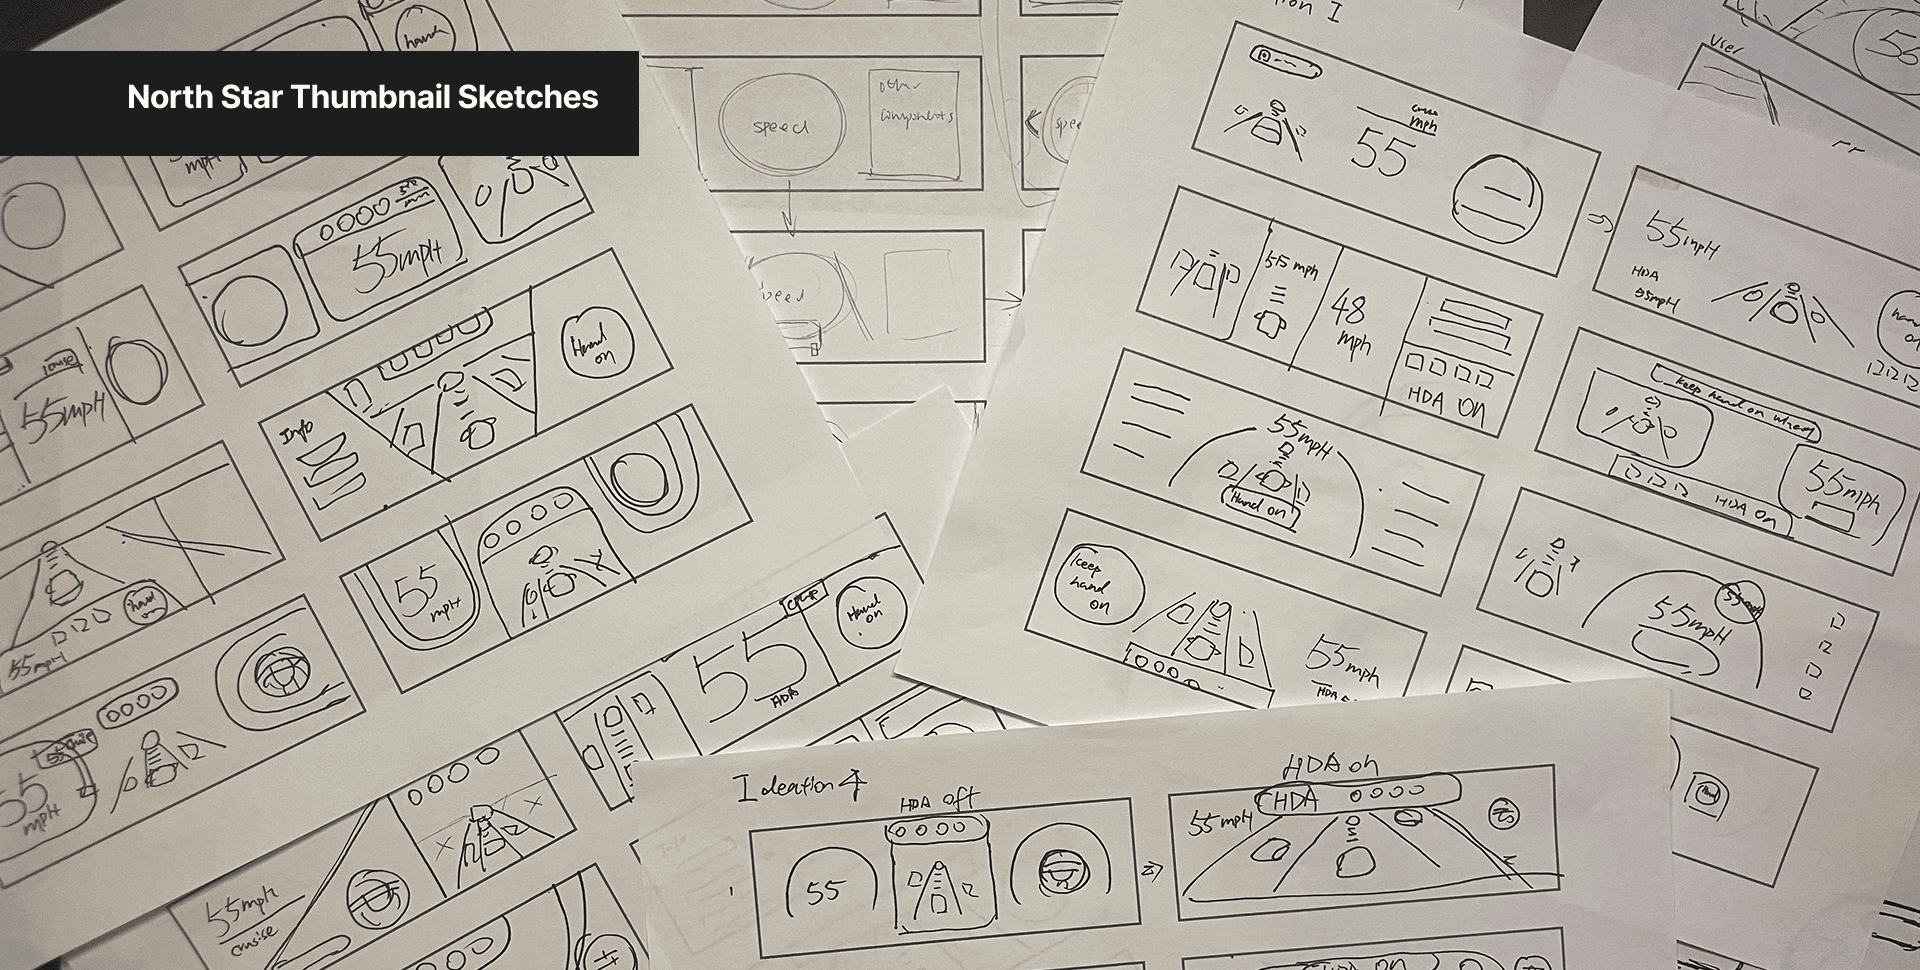
North Star Concept
We hope to see improvements in the simulator’s integration with the UI, allowing the users to “play” and “learn” how systems work.
By incorporating a more complex cityscape, we can further test the unpredictability found on the real road to get more accurate confidence metrics.
Testing drivers familiar with Hyundai vehicles will yield more accurate data as these were the participants that had the widest range of ratings